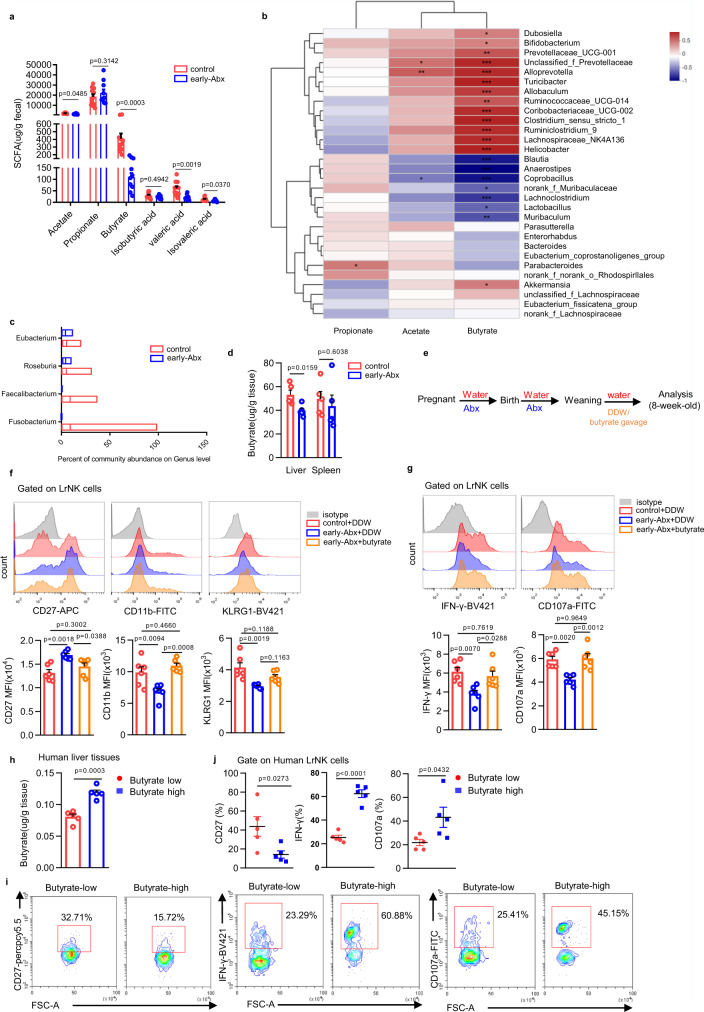
Fig. 4. Microbiota-derived butyrate facilitates functional maturation of LrNK cells.
a GC -MS analysis of short-chain fatty acids (SCFAs) was performed with feces from control or early-Abx mice (control n = 11, early-Abx n = 10). b The correlation heatmap between dominant bacteria and SCFAs in faeces through correlation numerical visualization. c The percentage of butyrate-producing bacteria on genus level from 16 S rRNA sequencing of faeces from control and early-Abx mice (control n = 11, early-Abx n = 10). The boxplot represents the median shown as a line in the center of the box, the boundaries are the first and third quartile, and whiskers represent the minimum and maximum values in the data. d Levels of butyrate in liver and spleen tissues from control and early-Abx mice by GC-MS analysis (n = 5 per group). e Experimental schemes of butyrate gavage mouse model. f Representative FACS plots and bar graph for the expression (MFI) CD27, CD11b, and KLRG1 on LrNK cells from different groups of mice (n = 6 per group). g Representative FACS plots and bar graph for the expression (MFI) of IFN-γ and CD107a in PMA and Ion-stimulated LrNK cells from different groups of mice (n = 6 per group). h Grouping according to butyrate level in normal liver tissue from hepatic hemangioma patients. i, j Representative FACS plots and bar graph of the percentage of CD27, IFN-γ and CD107a in LrNK cells from patients with high levels of butyrate and those with low butyrate levels. Dots represent data from individual mice or human patients, and error bars represent SEM per group in one experiment. Statistical analysis was performed by two-tailed Student’s t-test (a, d), parametric factorial Kruskal–Wallis (KW) sum-rank test (b) or one-way ANOVA with Tukey’s multiple comparisons test (f, g). *P < 0.05; **P < 0.01; ***P < 0.001; ****P < 0.0001; ns, no significance. Source data are provided as a Source Data file.

