
Fig. 2:
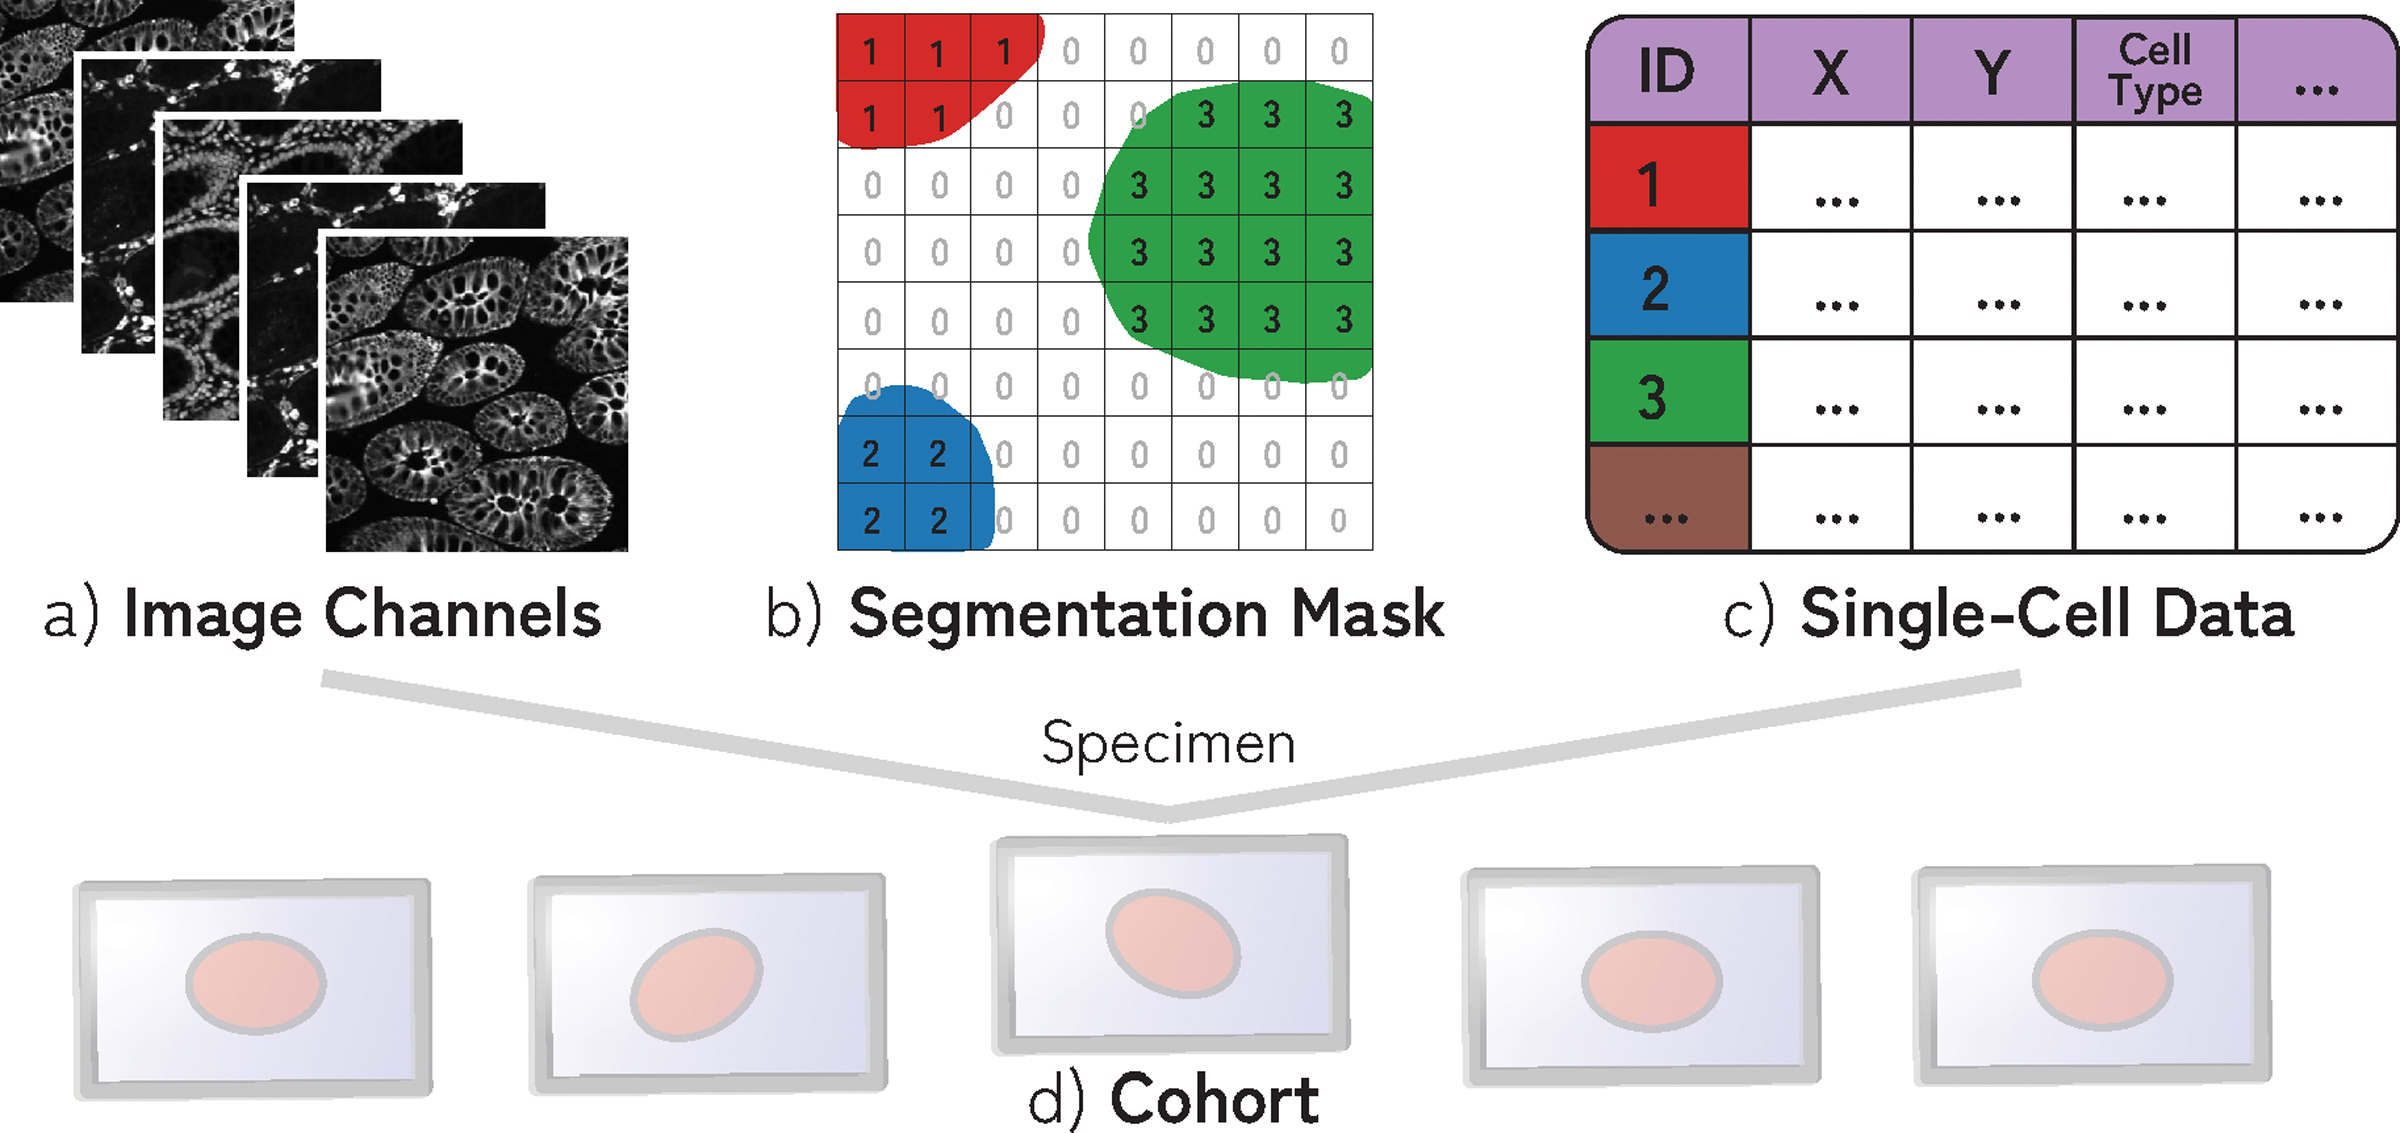
A specimen consists of (a) multi-channel image data, (b) segmentation mask of cells (often > 106 cells), and (c) single-cell data containing information about the position, cell type, and marker intensity values for each cell. (d) Specimens are often part of cohorts.