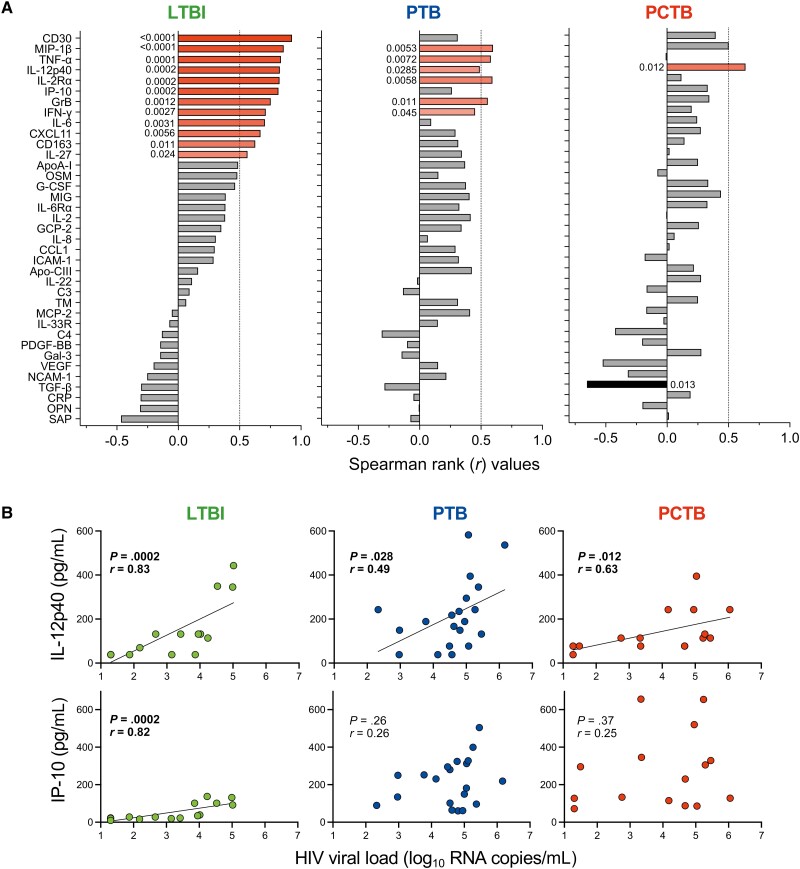
Figure 2.
Univariate associations between human immunodeficiency virus type 1 (HIV-1) viral load (VL) and analyte concentrations in the different tuberculosis (TB) groups. A, Spearman rank values of the univariate correlation between each analyte (see Materials and Methods for expansions of abbreviations of analytes) and the HIV-1 VL in plasma samples of participants with latent TB infection (LTBI), pulmonary TB (PTB), and pericardial TB (PCTB). Red bars indicate positive correlations, Black bars indicate negative correlations, and gray bars indicate nonsignificant correlations. B, Examples of IL-12p40 (maintained relationship between the TB groups) and IP-10 (disrupted relationship between the TB groups). The line indicates linear regression for statistically significant correlations.

