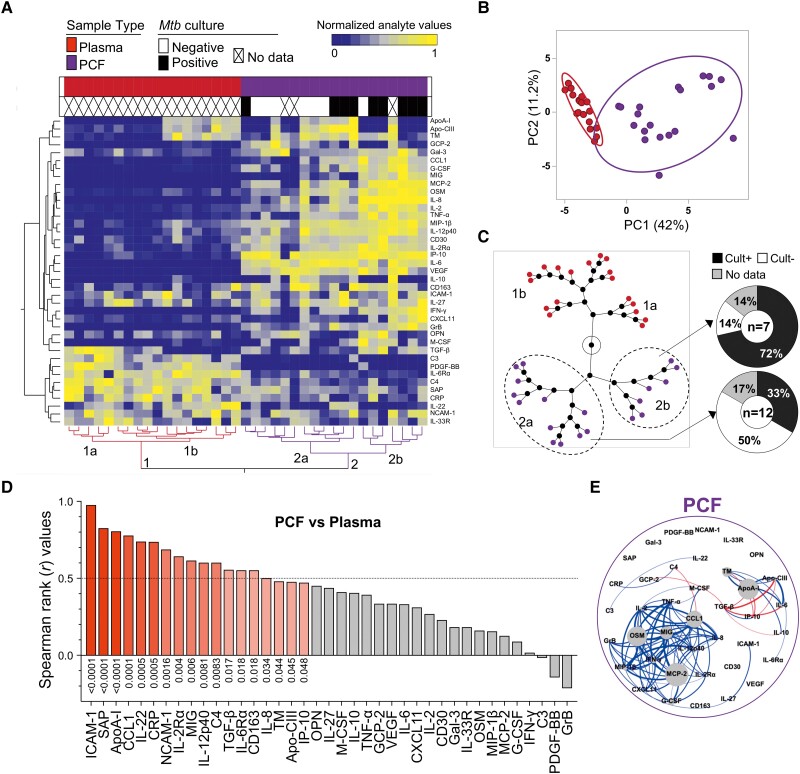
Figure 3.
Analyte profiles in peripheral blood (plasma) and site of disease (pericardial fluid [PCF]) in participants with pericardial TB (PCTB). A, Nonsupervised 2-way hierarchical cluster analysis (HCA, Ward method) was employed to evaluate the 2 sites using the 39 analytes. The sample type and Mycobacterium tuberculosis (Mtb) culture results (PCF in purple; plasma in red; Mtb culture negative in white and positive in black) of each patient is indicated at the top of the dendrogram. Data are depicted as a heatmap colored from minimum to maximum normalized values detected for each marker. B, Principal component analysis on correlations based on the 39 analytes was used to explain the variance of the data distribution in the subgroup. Each dot represents a participant. The 2 axes represent principal components 1 (PC1) and 2 (PC2). Their contribution to the total data variance is shown as a percentage. C, Constellation plot-cluster analysis based on all measured analytes. Each dot represents a participant and is color-coded according to sample type. Each cluster obtained for the HCA is identified by a number. D, Pairwise correlation of the 39 analytes (see Materials and Methods for expansions of abbreviations of analytes). Red bars indicate a positive correlation, black bars indicate a negative correlation, and gray bars indicate a nonsignificant correlation. E, Analyte network analysis in PCF of participants with PCTB. Size of nodes indicates the number of connections. Size of edges indicates the Spearman r (only r >0.6 was included). Blue lines: positive correlation. Red lines: negative correlation.

