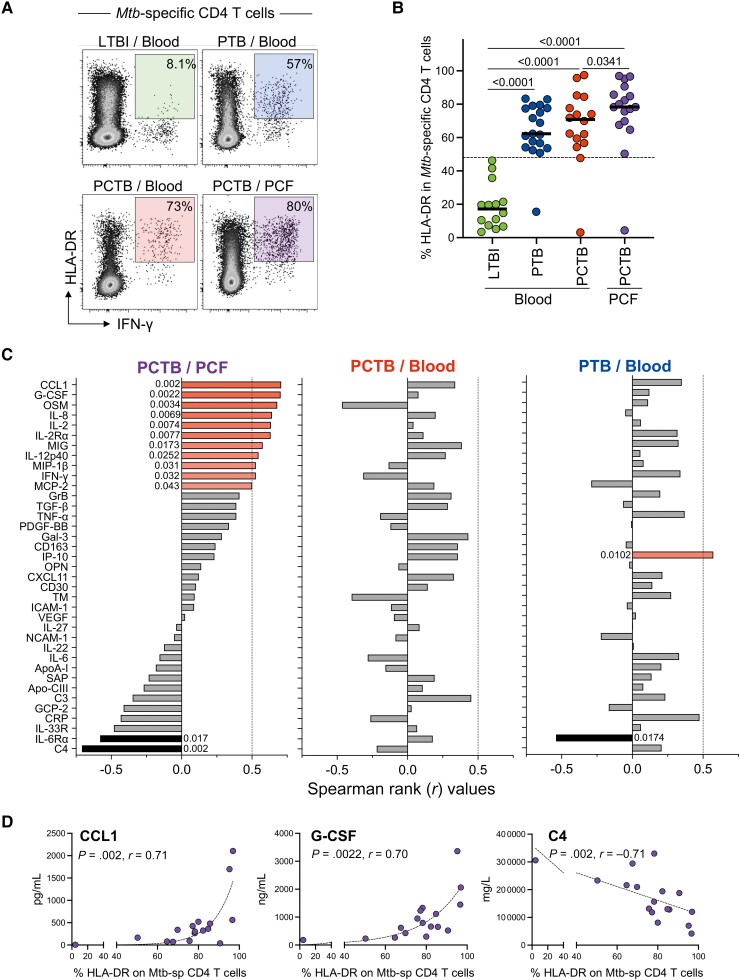
Figure 4.
Univariate associations between HLA-DR expression on Mycobacterium tuberculosis (Mtb)–specific CD4 T cells and analyte concentrations in the different tuberculosis (TB) groups. A, Representative flow cytometry plots of the expression of HLA-DR on Mtb-specific CD4 T cells. B, Expression of HLA-DR on Mtb-specific CD4 T cells in response to Mtb300. C, Spearman rank values of the univariate correlation between each analyte (see Materials and Methods for expansions of abbreviations of analytes) and between Mtb-specific CD4 T-cell activation (HLA-DR) level at the site of disease (pericardial fluid [PCF]) in participants with pericardial TB (PCTB), in blood of participants with PCTB and pulmonary TB (PTB), respectively. Red bars indicate a positive correlation, black bars indicate a negative correlation, and the gray bars indicate nonsignificant correlation. D, Representative graphs showing the positive (CCL1 and G-CSF) and negative (C4) correlation to HLA-DR frequency at the site of disease (PCF). Statistical comparisons were performed using a Kruskal-Wallis test, adjusted for multiple comparisons (Dunn test) for blood latent TB infection (LTBI) vs PTB vs PCTB, Wilcoxon test for blood PCTB vs PCF PCTB, and the Mann-Whitney test to compare blood LTBI and PCF PCTB.

