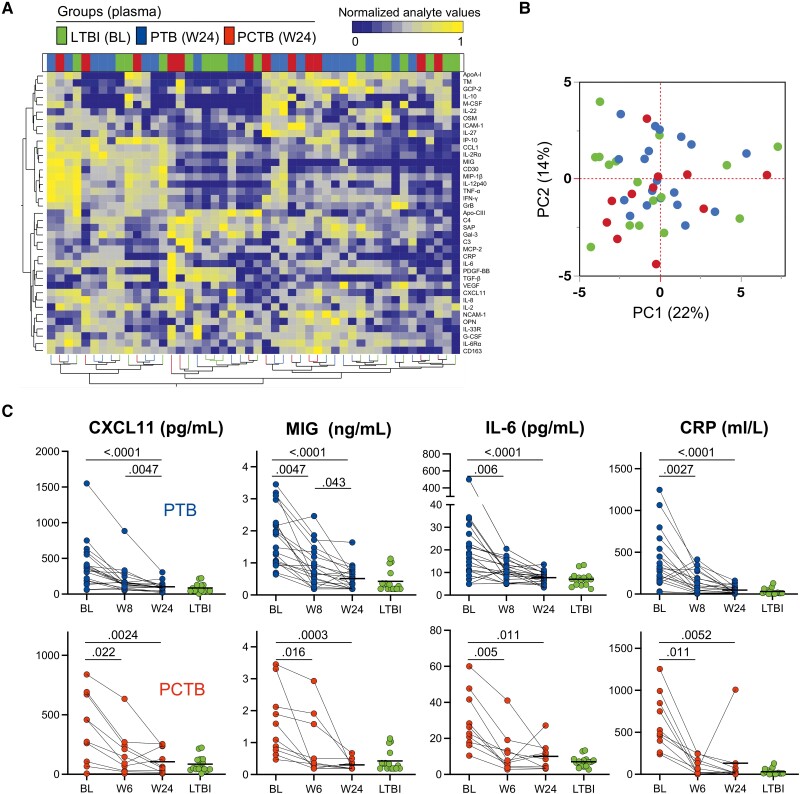
Figure 5.
Analyte profiles in the different tuberculosis (TB) groups before, during, and after TB treatment. A, Nonsupervised 2-way hierarchical cluster analysis (Ward method) was employed to grade the TB groups using the 39 analytes (see Materials and Methods for expansions of abbreviations of analytes). TB status (pericardial TB [PCTB] in red, pulmonary TB [PTB] in blue, and latent TB infection [LTBI] in green) of each patient is indicated at the top of the dendrogram. Data are depicted as a heatmap colored from minimum to maximum normalized values detected for each marker. B, Principal component analysis on correlations based on the 39 analytes was used to explain the variance of the data distribution in the cohort. Each dot represents a participant. The 2 axes represent principal components 1 (PC1) and 2 (PC2). Their contribution to the total data variance is shown as a percentage. C, Representative graphs showing the change of concentrations of CXCL11, MIG, IL-6, and CRP with treatment and no statistical difference between week 24 (W24) post–treatment initiation and LTBI in both PTB and PCTB groups, respectively. Statistical comparisons were performed using a Friedman test, adjusted for multiple comparisons (Dunn test) for baseline (BL) vs week 6 (W6)/week 8 (W8), BL vs W24, and W6/W8 vs W24, and the Mann-Whitney test to compare LTBI with W24. P values were adjusted using the Benjamini-Hochberg multiple testing correction.

