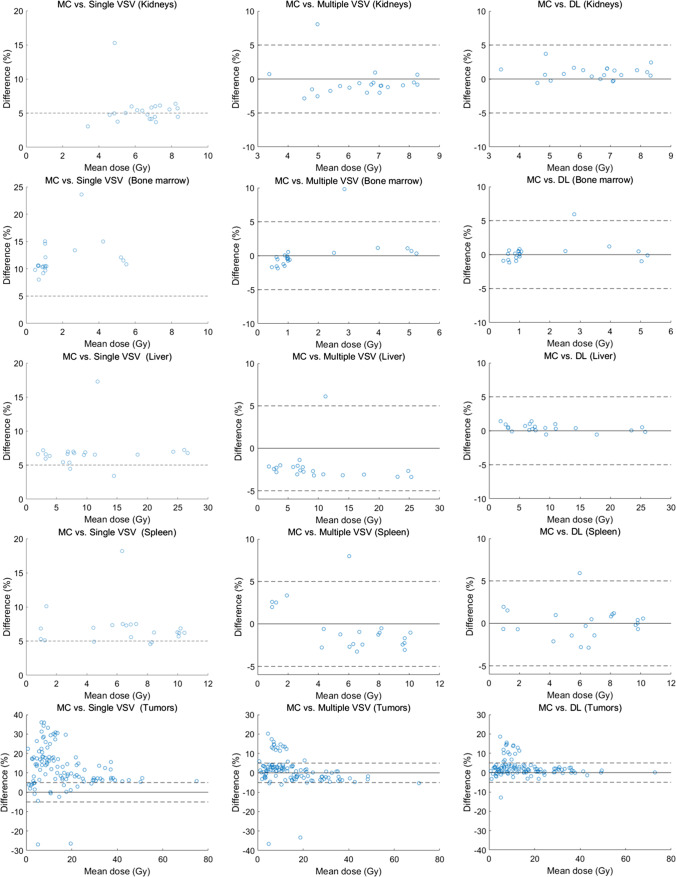
Fig. 2.
The Bland–Altman plots for comparison of dose estimation for each organ between the MC simulation approach and three different approaches. The first column is for the single VSV approach, the second for the multiple VSV approach, and the third for the DL-based approach. The dashed lines represent the baseline at − 5 and 5%

