Figure 1.
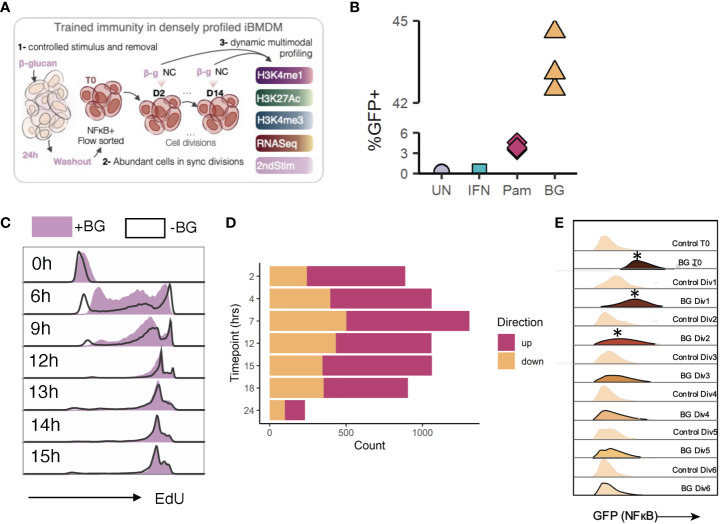
Experimental model design and validation. (A) General experimental plan. (B) Quantification of percent GFP+ cells among unstimulated cells, or cells stimulated with IFN (negative control), Pam3CSK4, or BG. Data are representative of 3 replicates per condition. (C) Naïve (no stimulus) iBMDMNFκB-GFP cells or iBMDMNFκB-GFP cells previously stimulated with 30 µg/mL beta glucan were incubated with EdU for 6, 9, 12, 13, 14, or 15 hours. At each time point, paired unstimulated and post-stimulation cells were collected. EdU was fluorescently labelled (BV421) by Click-it reaction. EdU incorporation was quantified by flow cytometry (gated on single cells). (D) Quantification of the number of differentially expressed genes (Log2FC>1, FDR<0.05) in iBMDMs after various hours of BG stimulation. (E) Histograms from flow cytometry analysis of GFP levels (FITC channel) in BGexp cells over time relative to paired controls.

