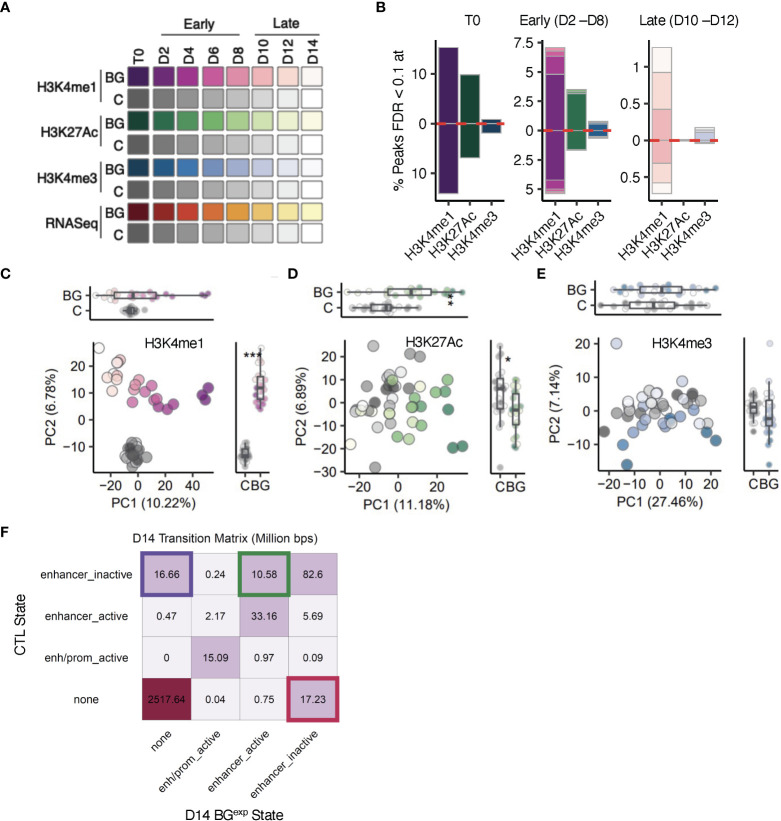
Figure 2.
The epigenetic landscape following BG stimulation and washout is characterized by changes in H3K4me1 at enhancer-like regions. (A) Sample overview. iBMDMNFκB-GFP cells were left unstimulated (C, gray scale), or stimulated with 30 µg/mL β-glucan (BG, purple, green, blue and red color scales) for 24 hours. Sorted C and BGGFP+ cells were returned to cell culture. Aliquots of C and BGexp cells were collected every 24 hours up to 168 hours (D2-D14) and used for downstream RNA-seq and ChIP-seq analysis. (B) Bar plots showing the proportion of sites with significantly altered levels of H3K4me1, H3K4me3, and H3K27Ac peaks at T0, early (D2, D4, D6, and D8) and late (D10, D12, and D14) timepoints (colors match the time points indicated in A). Red dotted line marks the direction of effect. (C) Principal component analysis (PCA) of H3K4me1 levels in BGexp cells collected between D2 and D14 and time-paired controls across (across 3 experimental replicates). PCs were calculated using log2(counts per million) reads for each sample across all H3K4me1 peaks. (D, E), represent same analysis as in C but for H3K27Ac and H3K4me3. (F) Transition matrix displaying the proportion of base pairs in each transition state at D14 related to enhancers (full transition matrix is in Figure S2G ). ChromHMM was used to segment the genome into 6 states using H3K4me1, H3K4me3, and H3K27Ac ChIP-seq data. Separate segmentations were performed with control and BG D14 ChIP-seq profiles. State assignments between control and BG D14 segmentation outputs were compared across the entire genome using 200 base pairs as the minimal unit.

