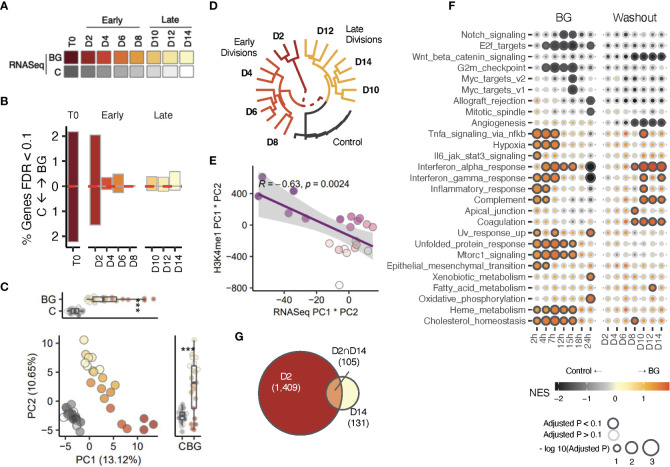
Figure 3.
Transcriptional changes correlate with H3K4me1 changes. (A) Sample overview for RNA-seq data. iBMDMNFκB-GFP cells were left unstimulated (C, gray scale), or stimulated with 30 µg/mL β-glucan (red color scale) for 24 hours. Sorted C and BGGFP+ cells were returned to cell culture. Aliquots of C and BGexp cells were collected every 24 hours up to 168 hours (D2-D14) and used for downstream RNA-seq (here) and ChIP-seq analysis (see Figure 2 ). (B) Bar plots showing the proportion of differentially expressed genes (DEG) at T0, early (D2, D4, D6, and D8) and later (D10, D12, and D14). Red dotted line marks the direction of effect. (C) Principal component analysis (PCA) of gene expression BGexp cells collected between D2 and D14 and time-paired controls across (across 3 experimental replicates). PCs were calculated using log2(counts per million) reads for each sample across. (D) Unsupervised hierarchical clustering analysis of samples based on transformed log2(counts per million) values of the set of differentially expressed genes (FDR<0.05) detected across all time points. Log (CPM) values of control replicates within each time point were averaged and displayed as a single point. (E) Correlation analysis of PC1×PC2 values in the PCA using gene expression data (x-axis) compared to PC1×PC2 values in the PCA from Figure 2C using H3K4me1 peak values. (F) Gene set enrichment analysis of Hallmark pathways performed using the fgsea R package. A separate gene set enrichment analysis was performed at each time point. Genes were ordered in descending order according to -log10(pvalue)×log2FC values (NES is Normalized Enrichment Score). Outlined circles indicate significant (padj<0.1) enrichment and color shading corresponds to NES score as indicated in the legend. Only pathways with significant enrichments for at least one time point are displayed. (G) Euler diagram displaying overlapping DEGs between the earliest division (D2) and latest one (D14). * indicates p-value Wilcoxon signed rank test < 0.05, *** indicates p < 0.0005.

