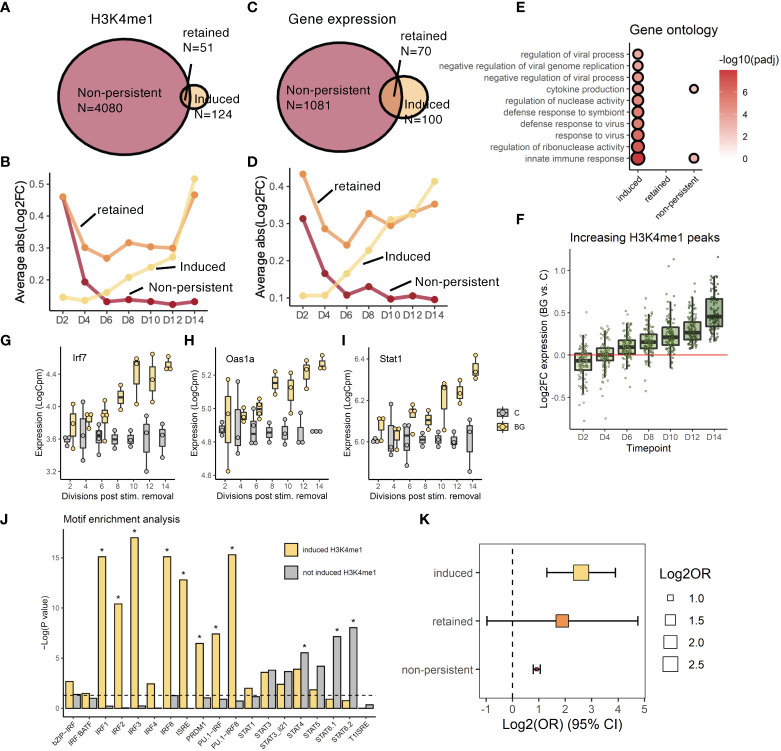
Figure 4.
Post-BG changes in the H3K4me1 landscape are coupled to signatures of altered TF activity. (A) Venn diagram of showing how H3K4me1 peaks were grouped into 3 trajectories based on differential levels at D2 (non-persistent), D14 (induced), or both timepoints (retained). (B) Trajectories of significant (fdr<0.05) H3K4me1 peaks categorized as non-persistent, induced, or retained. Y-axis is the mean absolute value of log2FC differential abundance across all peaks in the group. (C) Venn diagram showing how genes were grouped into 3 trajectories based on differential expression at D2 (non-persistent), D14 (induced), or both timepoints (retained). (D) Trajectories of significant (fdr<0.05) genes categorized as non-persistent, induced, or retained. Y-axis is the mean absolute value of log2FC differential expression across all peaks in the group. (E) Gene ontology analysis (Biological process pathways) on genes within each trajectory. Shown pathways are the top 10 most significantly enriched (fdr<0.05) pathways in the “induced” group. Circle size and color are scaled to –log10(fdr). (F) H3K4me1 peaks in the induced trajectory. (G-I) Examples of induced genes, Irf7, Oas1a, and Stat1. (J) Summary of homer motif enrichment results for interferon motifs performed on induced and non-induced H3K4me1 peaks (* denotes fdr < 0.05). (K) Log2 odds ratio (x axis) enrichment of genes in the ‘induced’, ‘retained’, or ‘non-persistent’ trajectories, among genes annotated to peaks in the ‘induced’, ‘retained’, or ‘non-persistent’ trajectories respectively.

