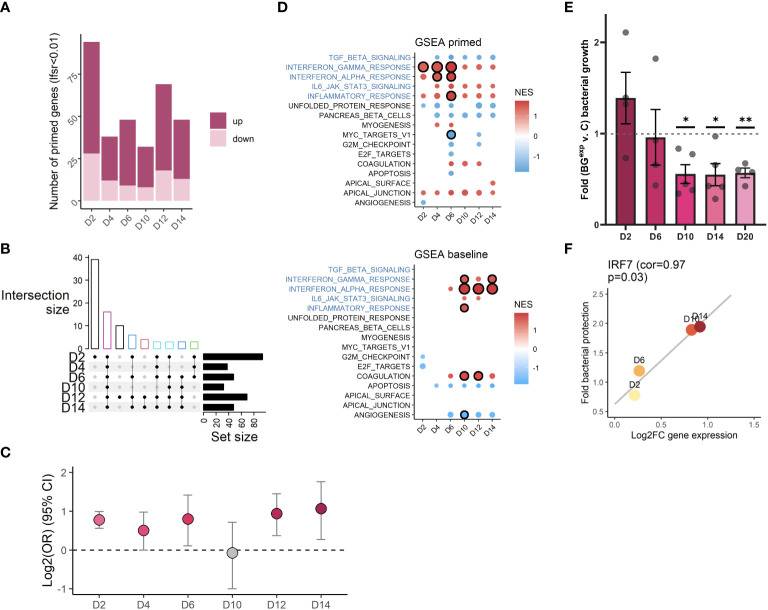
Figure 5.
Changes in H3K4me1 and gene expression are associated with evolving iBMDM functional responses. (A) Bar plot quantification of the number of primed genes per time point (lfsr < 0.01). (B) Upset plot showing overlap of primed genes across timepoints (showing only combinations with n>=3 genes). Bar colored by number of shared time points (black=1, red=2, green=3, dark blue=4, teal = 5, magenta=6). (C) Log2 odds ratio (y axis) enrichment of primed genes at each time point among genes annotated to significant peaks at the same time point. (D) Significantly enriched (circle with black outline, FDR<0.1) hallmark immune pathways among primed genes (top panel) and differentially expressed genes at baseline (bottom panel). Pathways with a circle but no outline have a p-value < 0.05. Circle size is scaled to –log10(padj). Color is scaled to normalized enrichment score (NES). (E) Fold change bacterial growth comparing BGexp relative to timepoint and experiment paired control (ratio paired t-test *p<=0.05, **p<=0.01). (F) Scatterplot showing log2FC expression of IRF7 at D2, D6, D10, and D14 on the x-axis and bacterial protection (inverse average fold change value at the respective timepoint shown in E) on the y-axis, with line of best fit (p=0.03, pearson correlation = 0.967).

