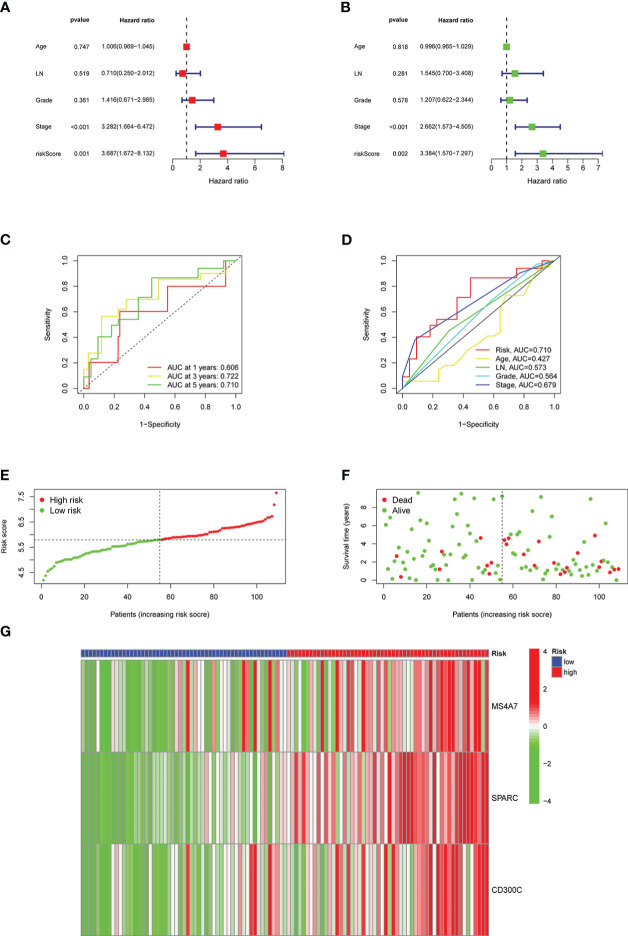
Figure 6.
Results of the risk classification and verification analysis as independent factors: A shows the results of univariate analysis, B shows the results of multivariate analysis, C shows the ROC curve using risk score as a single factor, D shows the ROC curve using risk score as one of the multiple factors, E shows the results of division of high- and low-risk groups, F shows the results of survival condition analysis, G shows the expression results of MS4A7, SPARC, and CD300C.

