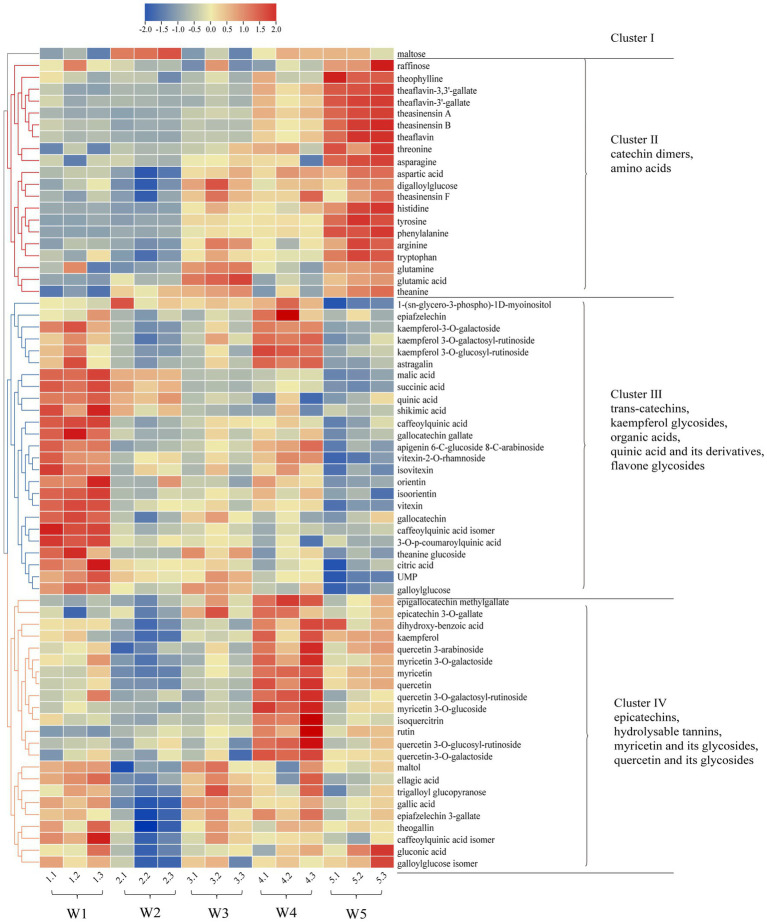
Figure 4.
Heatmap of the 69 differential compounds in Longjing tea samples with different withering degrees. Red and blue colors indicate metabolite levels above and below the average of all samples at different withering degrees, respectively. Data are shown as the mean of the relative intensities of three replicates after unit variance (uv) scaling. Hierarchical clustering was performed based on Pearson correlation.

