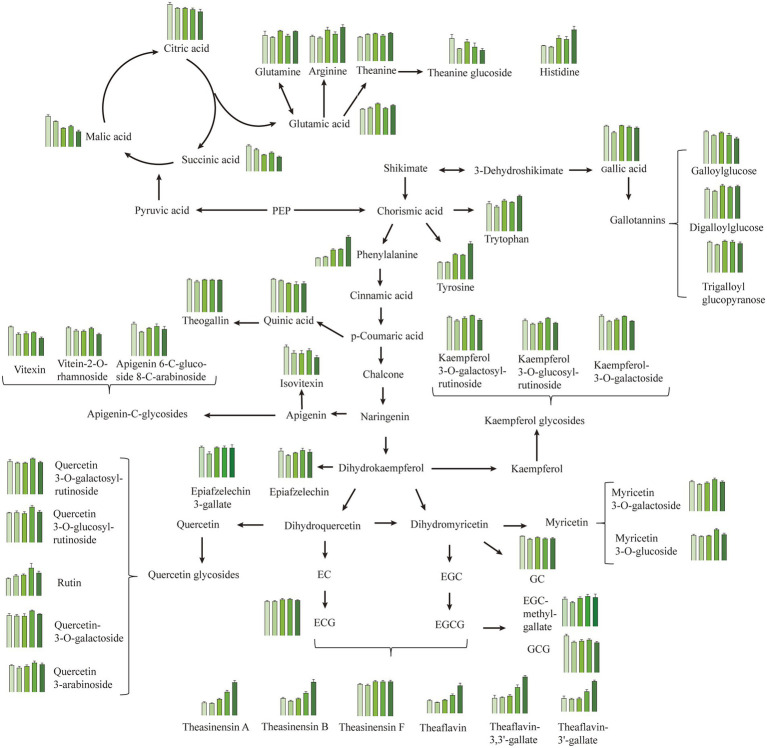
Figure 5.
Metabolism pathways of the main metabolites in Longjing tea with different withering degrees, including phenolics, organic acids, and amino acids. The bar plots show the metabolite contents in W1, W2, W3, W4, and W5 from left to right. Data is displayed as mean ± SD using relative abundance which was calculated by normalizing to the total ion intensity. All metabolites shown in the bar plot were significantly differential (one-way ANOVA with LSD post hoc test, p < 0.05). PEP, phosphoenolpyruvate.

