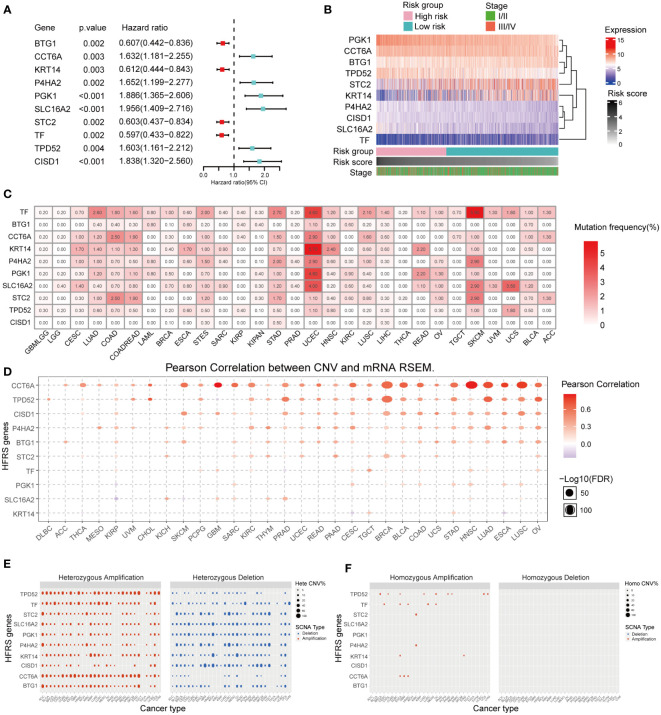
Figure 3.
Prognosis value and expression of HFRS hub genes. (A) Forest plot shows the prognostic value of 10 prognostic genes in signature. (B) Heat map shows the relationship between mRNA expression levels of 10 HFRS genes, HFRS score, and tumor stage features in the TCGA cohort. (C) The mutation frequencies of 10 HFRS genes in pan-cancer. (D) The correlation between CNV and mRNA expression of HFRS genes in pan-cancer using Pearson analysis. The size of bubble indicated the -log10 (FDR) value. (E, F) The profiles of heterozygous (E) and homozygous (F) amplification/deletion of 10 HFRS genes in cancers.

