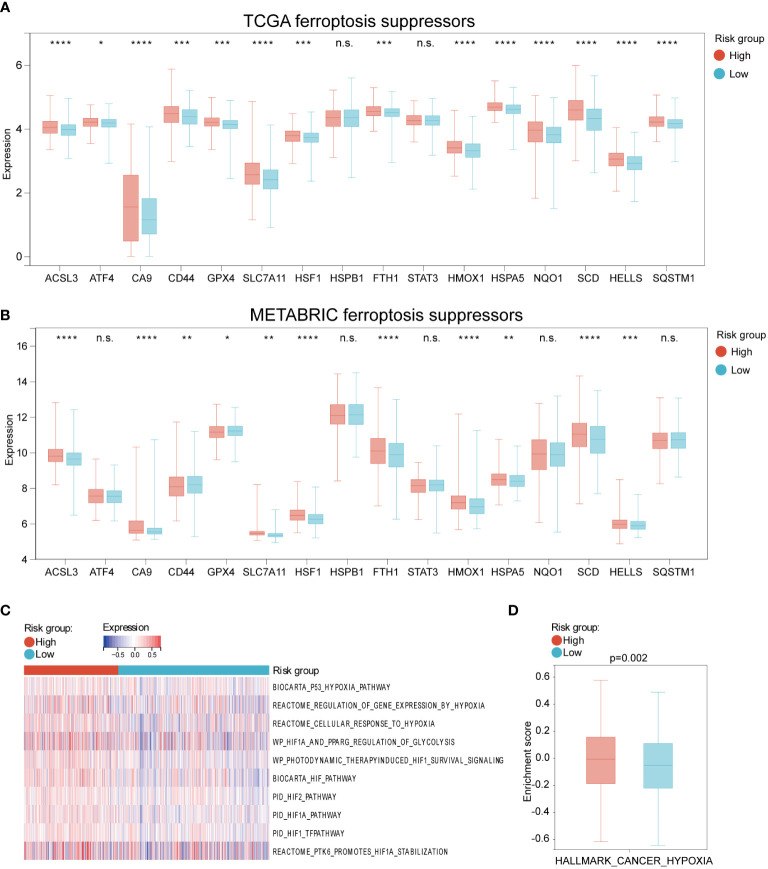
Figure 5.
The different expression of ferroptosis and hypoxia regulations between high and low HFRS risk groups. (A, B) The boxplots shows the difference in ferroptosis suppressors mRNA expression between the high- and low-HFRS groups of the TCGA (A) and METABRIC (B) cohorts. (C) The heat map shows the association between Reactome hypoxia-related pathways and HFRS score in TCGA BC samples. (D) The boxplot shows the significant difference in the enrichment score of HALLMARK_CANCER_HYPOXIA between high- and low-HFRS risk groups. (*p< 0.05; **p< 0.01; ***p< 0.001; ****p< 0.0001, n.s., not significant).

