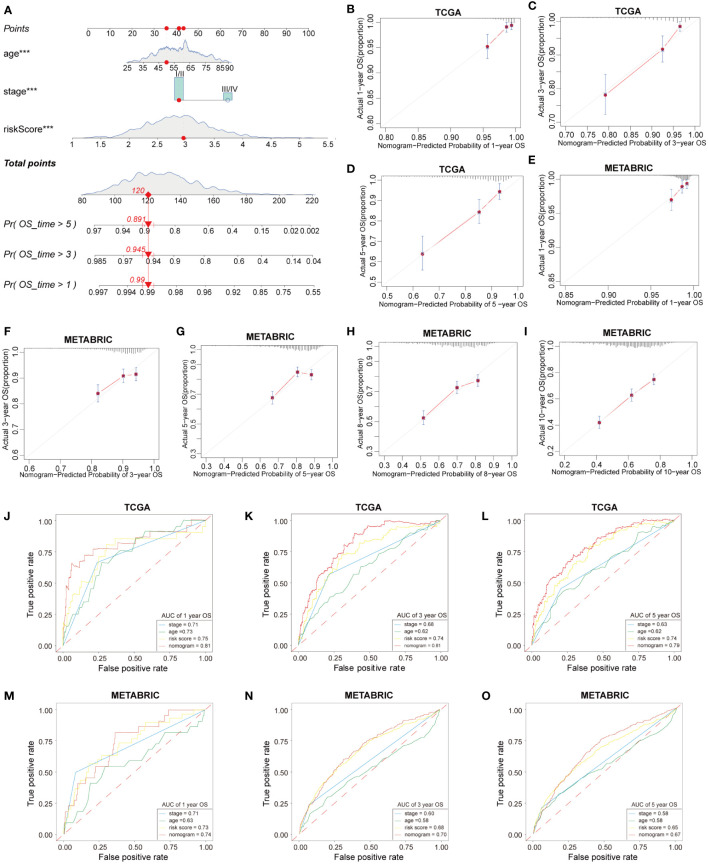
Figure 8.
Construction and validation of nomogram. (A) The nomogram based on HFRS risk score, age and tumor stage for predicting overall survival of BC patients. (B–D) Calibration plots of the nomogram for predicting the probability of OS at 1, 3, and 5 years in the TCGA cohort. (E-I) The calibration plots of the nomogram for predicting 1-, 3-, 5-, 8-, and 10-year OS in the METABRIC cohort. (J–L) ROC curves of nomogram, risk score, tumor stage, age for predicting 1-, 3-, 5-year OS in the TCGA cohort. (M–O) ROC curves of nomogram, risk score, tumor stage, age for predicting 1-, 3-, 5-year OS in the METABRIC cohort.

