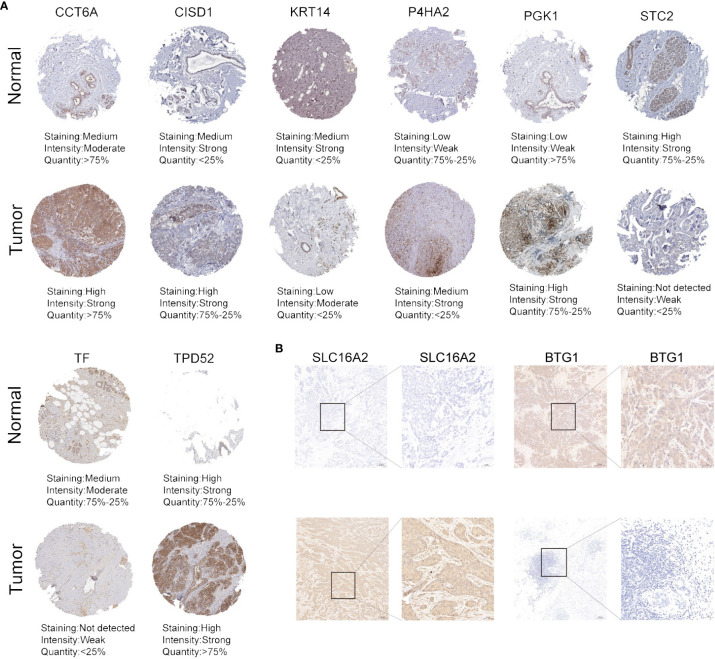
Figure 9.
The protein expression of HFRS genes in normal and tumor samples. (A) Representative immunohistochemistry images of CCT6A, CISD, KRT14, P4HA2, PGK1, STC2, TF, and TPD52 expression between BC tissues and adjacent normal tissues. (B) IHC staining shows the protein expression of SLC16A2 and BTG1 in BC tissues and adjacent normal tissues. Scale bar: 100μm.

