Figure 1.
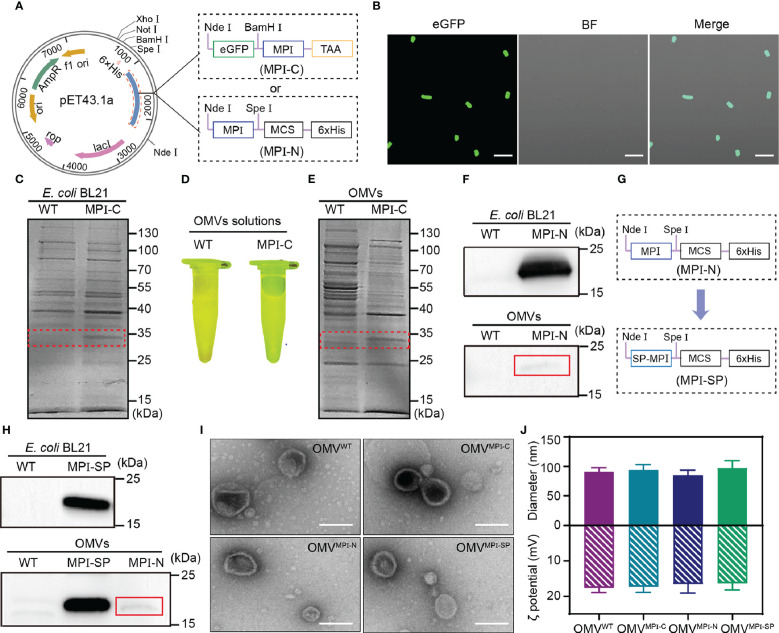
Preparation and characterization of OMVs. (A) Schematic representation showing constructions of pET43.1a-MPI-C and pET43.1a-MPI-N. (B) CLSM images of transformed E. coli (BL21) expressing eGFP-MPI (MPI-C) fusion peptide. BF, bright field. Scale bars = 10 μm. (C) SDS-PAGE analysis of total proteins from WT and transformed E. coli (BL21) expressing MPI-C fusion peptide. The red dashed box indicates the position of MPI-C. (D) Fluorescence image of OMVWT and OMVMPI-C solutions excited by blue light. (E) SDS-PAGE analysis of total proteins from OMVWT and OMVMPI-C. The red dashed box indicates the position of MPI-C. (F) Western blot analysis of MPI-N expressions in transformed E. coli (BL21) and the corresponding OMVs. The red line box indicates the slight band of MPI-N. (G) Schematic representation of pET43.1a-MPI-SP construction. (H) Western blot analysis of MPI-SP expression in transformed E. coli (BL21) and the corresponding OMVs. MPI-N expression in OMVs shown in the bottom panel is used as a control. The red line box indicates the slight band of MPI-N. (I) TEM images of OMVWT, OMVMPI-C, OMVMPI-N, and OMVMPI-SP. Scale bars = 100 nm. (J) Histogram showing hydrodynamic sizes and zeta potentials of OMVWT, OMVMPI-C, OMVMPI-N, and OMVMPI-SP. Measurements with DLS were repeated three times. Data are presented as mean ± SD.

