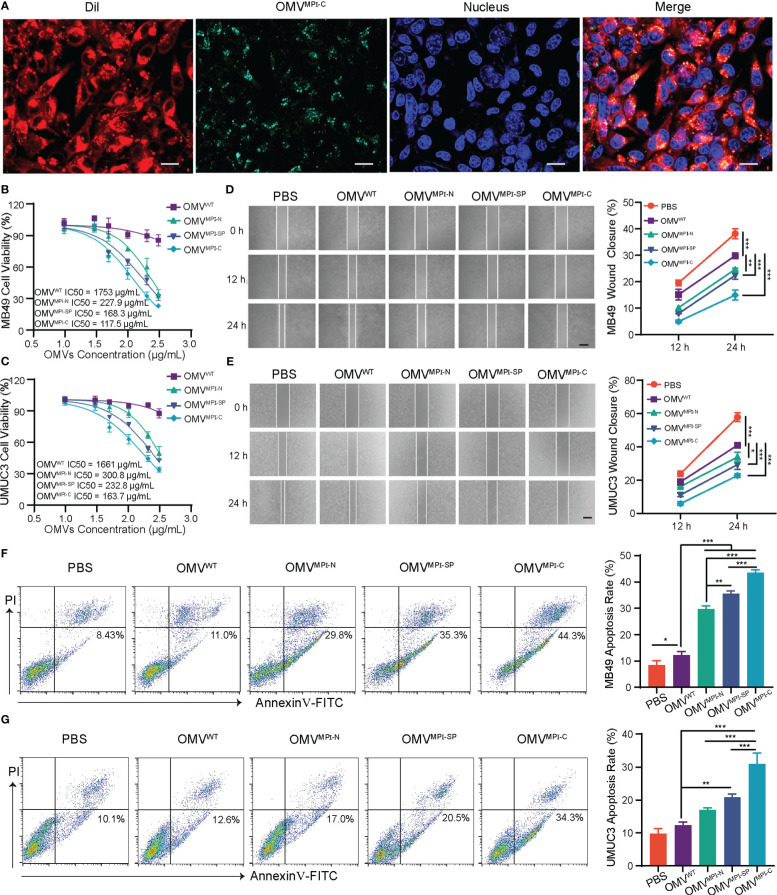
Figure 2.
The antitumor effects of bioengineered OMVs in vitro. (A) CLSM images representing DiL-labeled OMVMPI-C endocytosis by MB49 cells after 6-h incubation. Cell nuclei were stained with Hoechst 33342 (blue). Scale bar = 20 μm. IC50 curves of MB49 (B) and UMUC3 (C) after treatment with different OMV formulations for 24 h (n = 3). Representative images and quantification analysis of MB49 (D) and UMUC3 (E) cell wound-healing assay after treatment with different OMV formulations (100 μg/ml). Images were obtained at 0, 12, and 24 h (n = 3). Scale bars = 100 μm. Representative FCM results and corresponding quantification analysis showing the percentages of apoptotic MB49 (F) and UMUC3 (G) cells after treatment with different OMV formulations (100 μg/ml) for 48 h (n = 3). Data in (B–G) are presented as mean ± SD. ns, no significance; *p < 0.05, **p < 0.01, ***p < 0.001.

