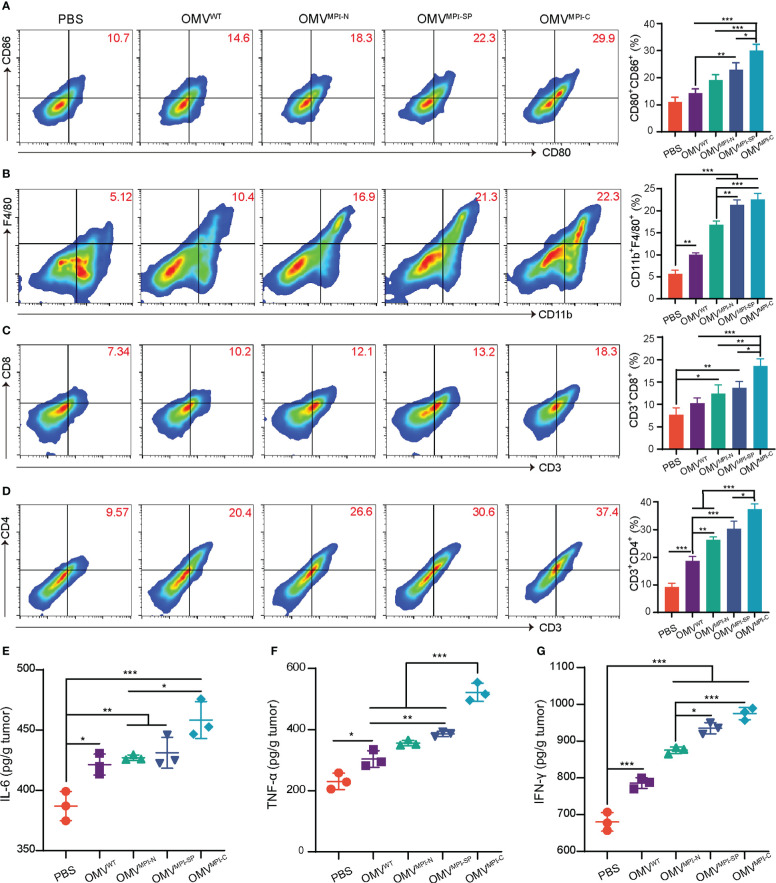
Figure 4.
Stimulation of antitumor immunity by bioengineered OMVs. (A) Representative FCM analysis results of mature DCs (CD80+CD86+ gated on CD11c+) and the corresponding percentages of CD80+CD86+ DCs in tumors (n = 3). (B) Representative FCM analysis images of CD11b+F4/80+ macrophages and the corresponding percentages in MB49 tumors (n = 3). Representative FCM plots of CD3+CD8+ (C) and CD3+CD4+ (D) T lymphocyte infiltration (both gated on CD45+) and the corresponding quantitative analysis (n = 3). The levels of pro-inflammatory cytokines including IL-6 (E), TNF-α (F), and IFN-γ (G) in tumor tissues after treatment with different OMV formulations (n = 3). Data are presented as mean ± SD. Statistical significance was calculated via one-way ANOVA with a Tukey’s post-hoc test. *p < 0.05, **p < 0.01, ***p < 0.001.

