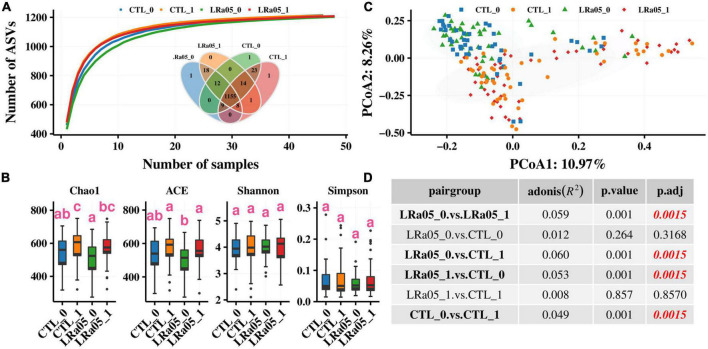
FIGURE 3.
Changes in alpha and beta diversity in the gut microbiota of subjects from before to after the intervention. (A) Species accumulation curve. The Venn diagram shows the distribution of species across the CTL and LRa05 groups. (B) Changes in alpha diversity from before to after the intervention. (C) Changes in beta diversity from before to after the intervention. Principal component analysis based on the Bray–Curtis distance at different consumption stages and in different groups. Each point represents the gut microbiota composition of one subject. (D) Comparison of the significance of beta diversity between the groups.

