
Figure 3.
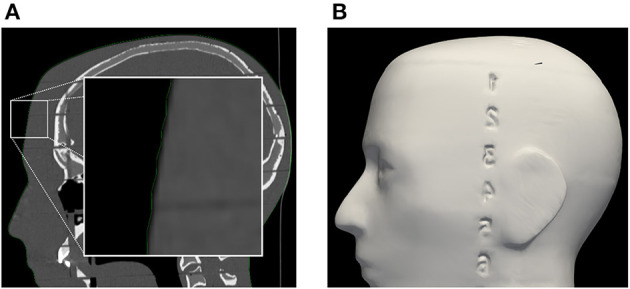
(A) Segmentation of phantom CT data used for the creation of (B) the target surface-model during pre-clinical registration validation. Note: the enlarged region in the left image indicates a minor surface bias ( ≤ 1 mm) in all dimensions of the surface model (green outline). This bias was discovered in retrospective analysis and could be due to thresholding and partial volume effect of the CT scan images.