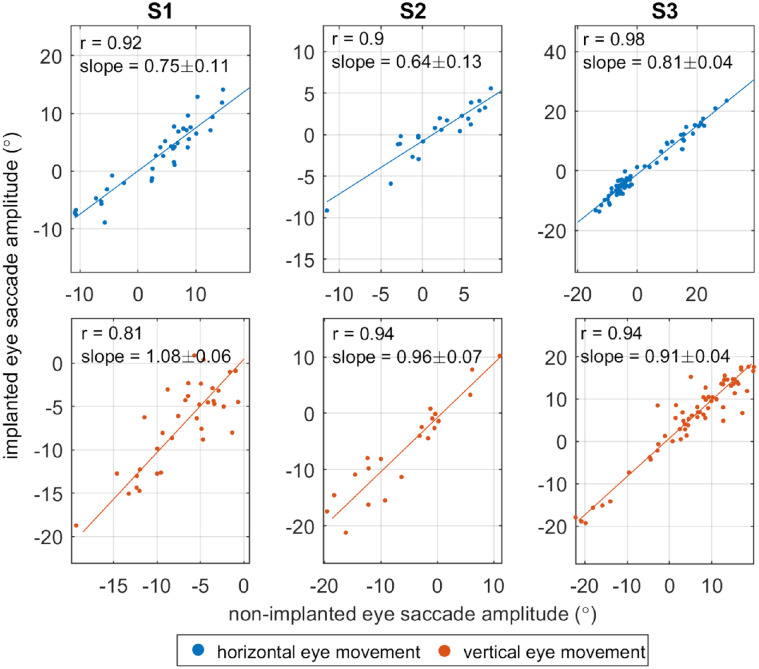
Figure 2.
Comparison of saccade amplitudes for the implanted eye versus the nonimplanted eye. Each point represents the horizontal (blue) or vertical (red) change in gaze angle during the saccade made in response to electrode stimulation in a single trial of the gaze-based mapping task. For horizontal eye movement (blue), positive values indicate rightwards movement. For vertical eye movement (red), positive values indicate upwards movement. A linear total least-squares regression model was fitted for each dataset (solid lines), followed by a bootstrapping of the regression residuals. The resulting 95% confidence interval of the gradient is displayed in the top left of each panel. Gradients of less than one indicate that movement of the implanted eye was attenuated with respect to the nonimplanted eye.

