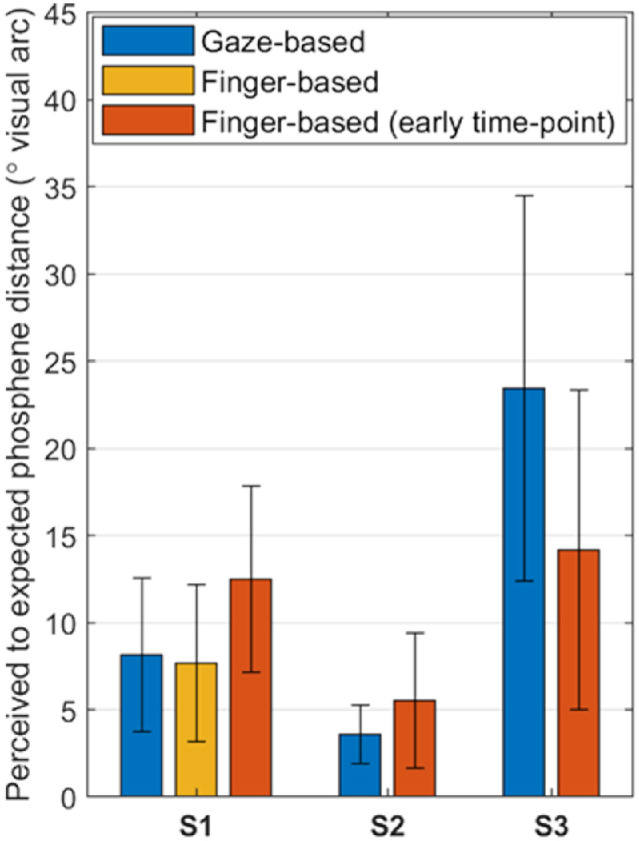
Figure 4.

Mean distance (± SD) from the estimated phosphene location (behavioral response) to the retinotopic electrode location for each subject and task. Results from an additional touchscreen finger-based mapping session (orange) are included for S1.
