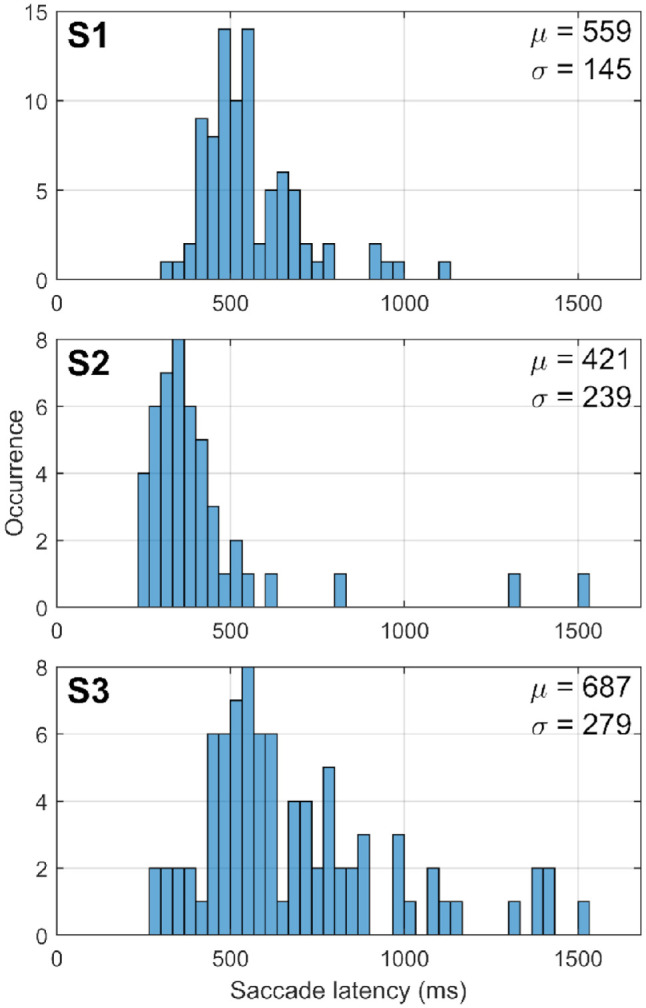
Figure 5.

Histograms showing the distribution of saccade latency in the gaze-based phosphene mapping task for each subject, S1 to S3. Saccade latency is measured from stimulus onset to saccade onset. The mean latency (µ) and standard deviation (σ) are indicated at the top-right corner of each panel.
