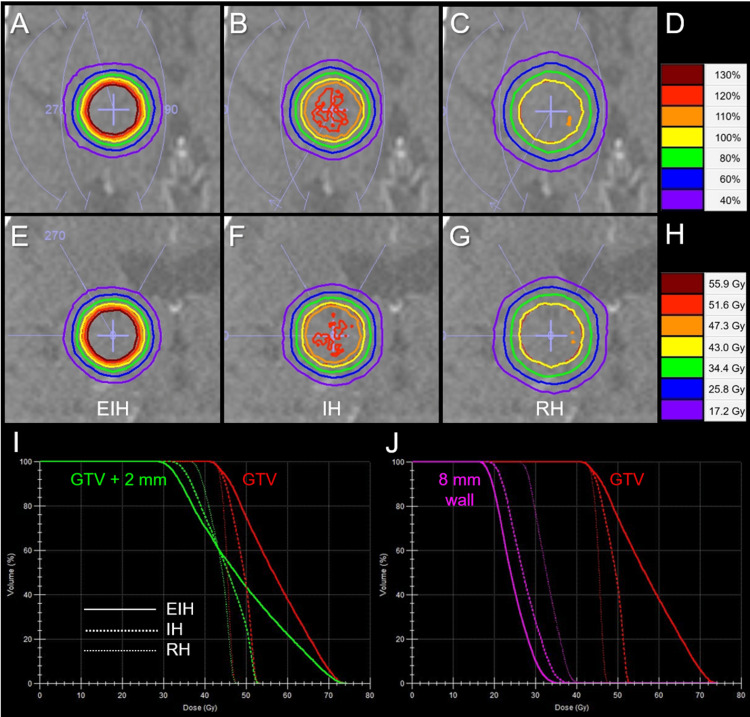
Figure 2. Comparison of dose distributions and dose-volume histograms for a gross tumor volume of a 20-mm-diameter tumor.
The images show dose distributions (A-C, E-G); axial views (A-C); coronal views (E-G); EIH plan (A, E); IH plan (B, F); RH plan (C, G); representative % isodoses normalized to 100% at the prescribed dose (PD) (D); representative isodoses with 43 Gy in five fractions assigned to GTV D98% (H); dose-volume histograms (DVHs) (I, J).
(H, I) As a clinical example, 43 Gy in five fractions is assigned to the GTV D98%. (I) The DVHs of GTV and GTV + 2 mm object show the differences in the dose inhomogeneities of GTV and the marginal doses of GTV + 2 mm. (J) The 8-mm wall object is defined as (GTV + 10 mm) minus (GTV + 2 mm).
GTV, gross tumor volume; EIH, extremely inhomogeneous; IH, inhomogeneous; RH, rather homogeneous

