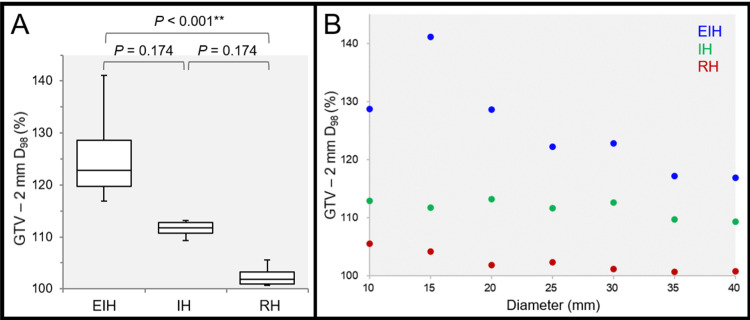
Figure 6. Comparison of the marginal doses of 2 mm inside the gross tumor volume.
The images show the GTV - 2 mm D98% (%) relative to 100% of the PD (A, B); the BWPs along with the results of FT and SPHT (A); and the scatter plots (B).
(A) FT proved a significant difference among the three groups (P < 0.001 ***, KCC = 1.000). (B) The GTV - 2 mm D98% values are significantly correlated with the GTV diameter in the EIH plan (P = 0.003 **, rho = -0.929), RH plan (P = 0.003 **, rho = -0.929), while not in the IH plan (P = 0.052, rho = -0.750).
EIH, extremely inhomogeneous; IH, inhomogeneous; RH, rather homogeneous; BWP, box-and-whisker plot; FT, Friedman’s test; SPHT, Scheffe’s post hoc test; PD, prescribed dose; GTV, gross tumor volume; KCC, Kendall’s coefficient of concordance

