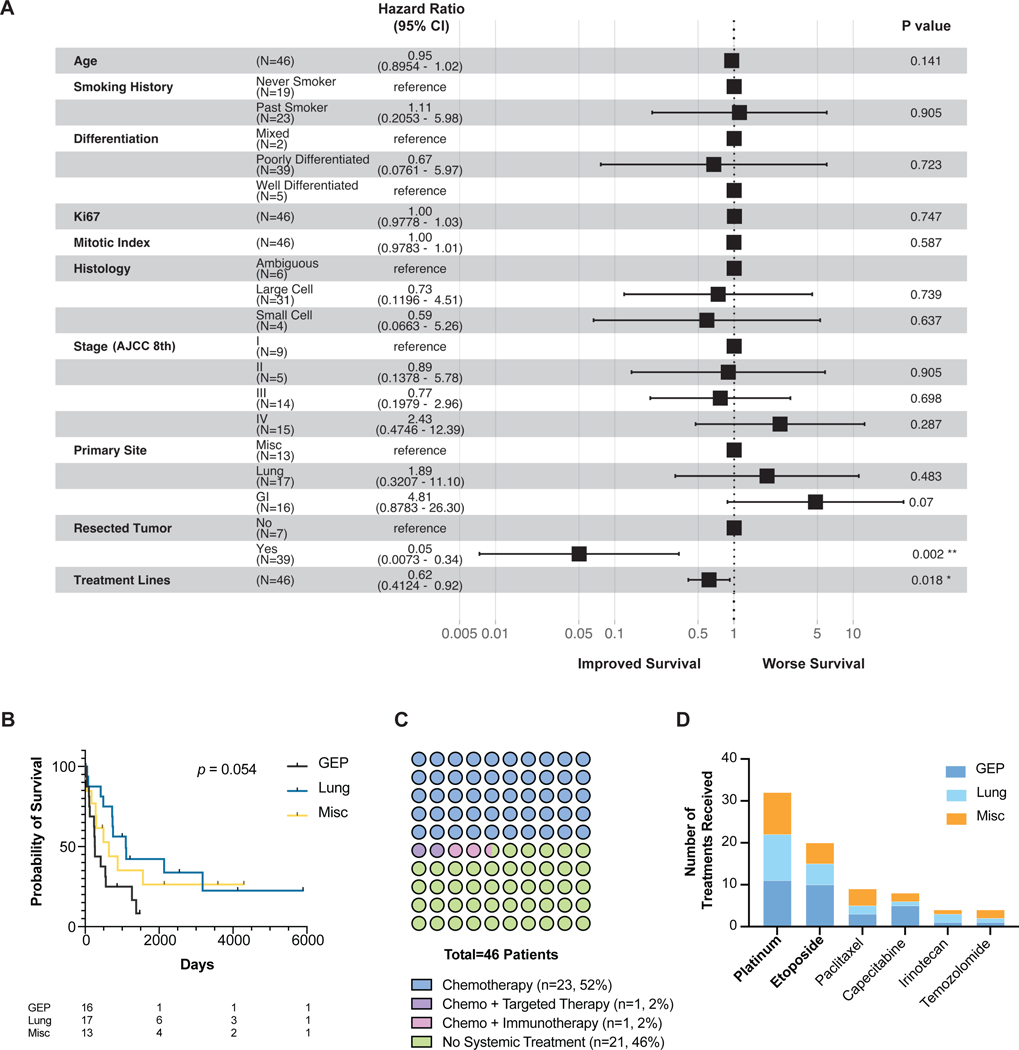
Figure 1. Clinical characteristics.
(a) Forest plot of Cox multivariate analysis of 46 patients.
(b) Kaplan-Meier survival curve of patients separated by tissue origin. Table lists the numbers at risk.
(c) Dot plot of systemic therapies received per patient. In the No Systemic Treatment group, surgery, radiation and/or hospice services were administered.
(d) Number of treatments of each chemotherapy received. Some patients received the same chemotherapy more than once. Only the most frequent chemotherapies were listed.
Abbreviations: GEP, gastroenteropancreatic. Misc, miscellaneous. AJCC, American Joint Committee on Cancer.

