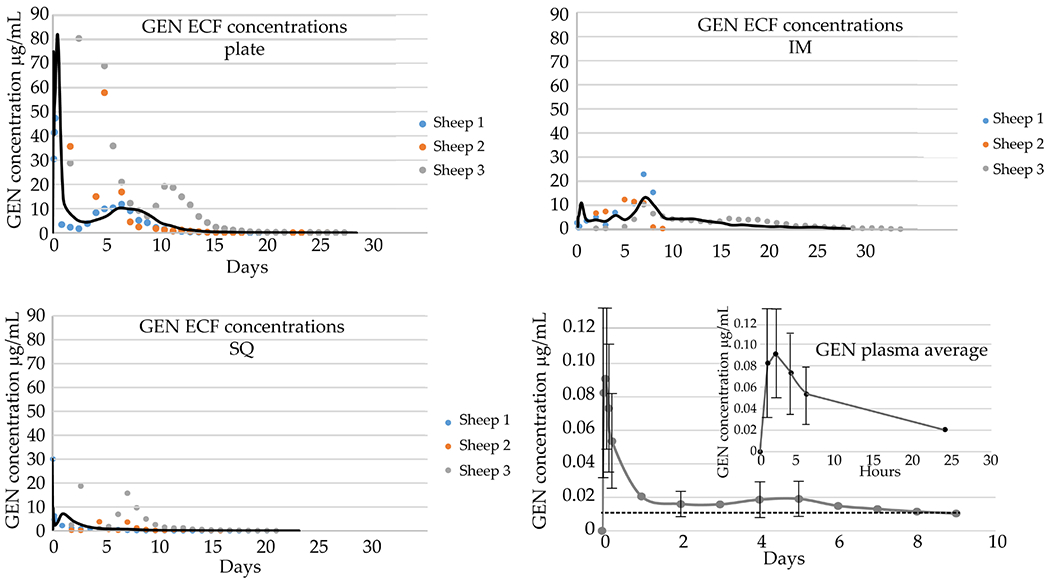
Fig. 3. GEN ECF and plasma concentrations over time.

GEN ECF concentrations at each sampling interval from 3 ultrafiltration probe locations: IM cavity, SQ, periosteal/adjacent to plate (plate). Each ECF graph shows data from individual sheep as well as the average plotted as a continuous black line. IM probe: maximum mean concentration (Cmax) 13.1 μg/mL, time of Cmax (Tmax) 7 d. Plate probe: Cmax 80.5 μg/mL, Tmax 12 h. SQ probe: Cmax 30.0 μg/mL, Tmax 0 h. Plasma GEN concentration at each sampling interval with a Cmax 90.5 ng/mL, Tmax 2 h. Values from 8 animals were used to determine the shape of the elution curves. The dotted line represents the limit of detection, 0.010 μg/mL, and only data points that were above this detection limit were used in the analysis. The error bar is missing for 24 h time point as n < 3 samples due to the detection limit.
