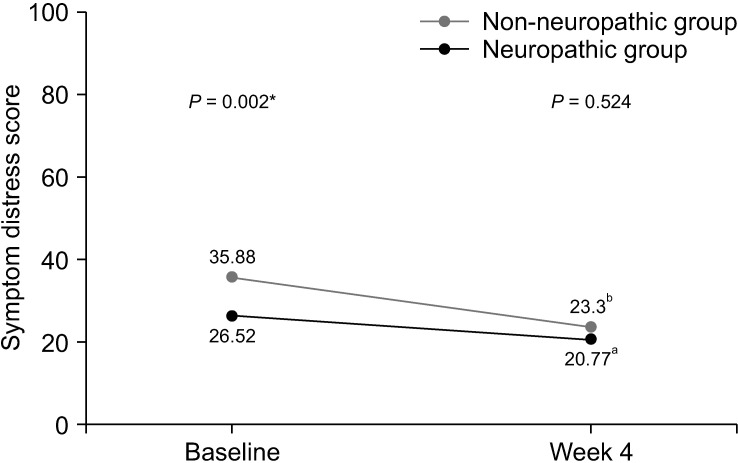
Fig. 5.
Line graph showing changes of symptom distress score of Edmonton Symptom Assessment Scale between baseline and week 4. *Independent t-test was used and a P value of less than 0.05 indicates statistically significant difference between two groups at baseline. aPaired t-test demonstrated statistically significant difference between symptom distress score of patients in non-neuropathic group at baseline and week 4 (P = 0.040). bPaired t-test demonstrated statistically significant difference between symptom distress score of patients in neuropathic group at baseline and week 4 (P = 0.002).

