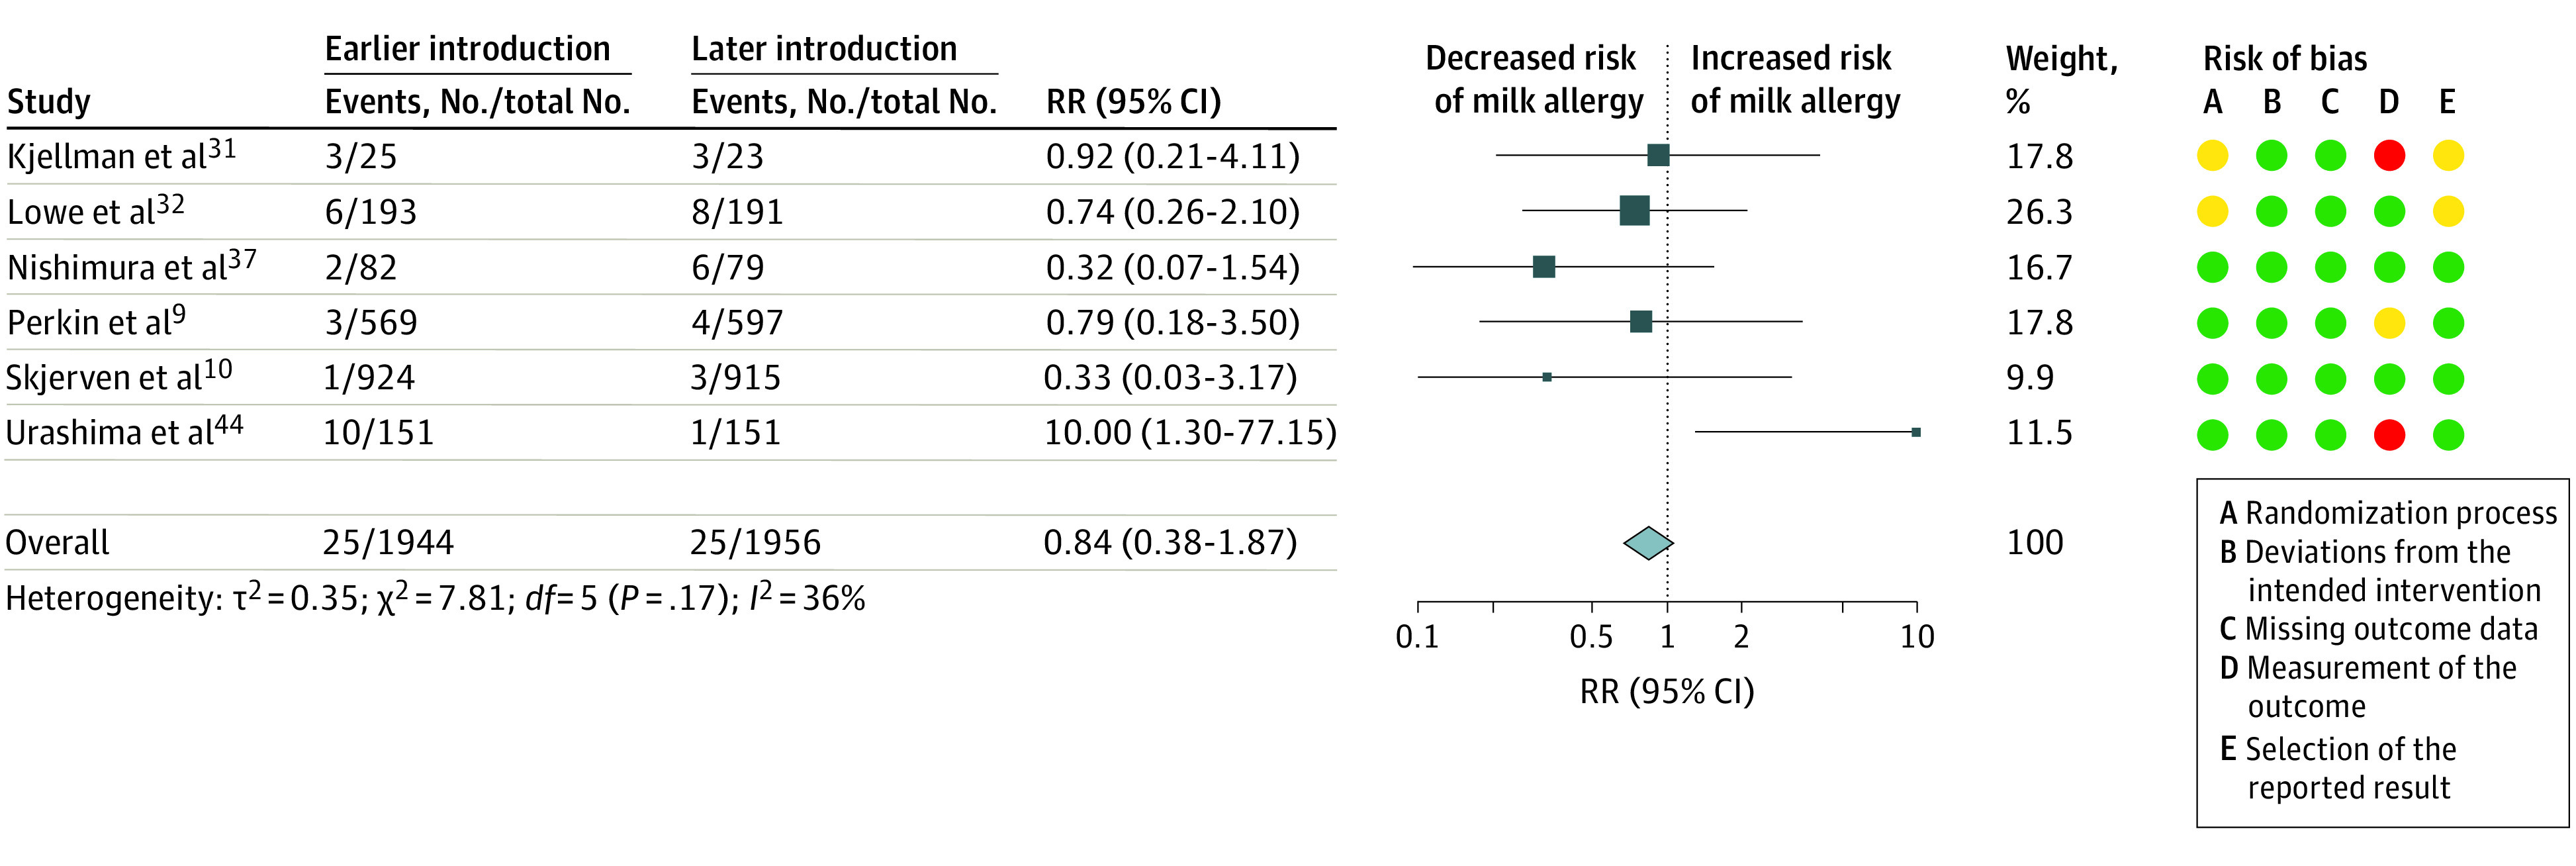
Figure 4. Earlier vs Later Introduction of Cow’s Milk and Risk of Cow’s Milk Allergy.

Squares indicate risk ratios (RRs), with horizontal lines indicating 95% CIs and size of squares indicating weight; diamond indicates the pooled estimate, with outer points of the diamond indicating the 95% CI. Green circles indicate low risk of bias; yellow, some concerns; and red, high risk of bias.
