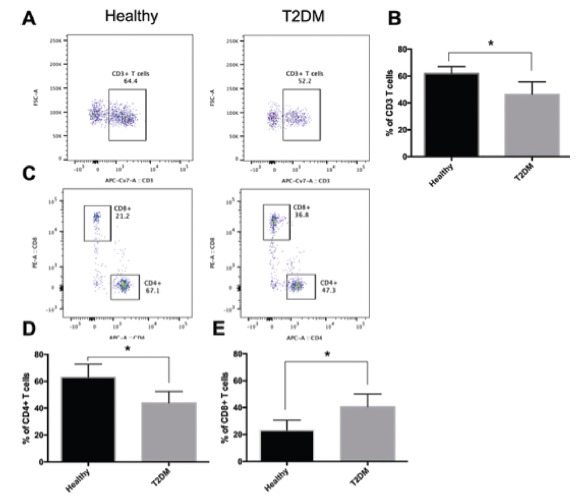
Figure 3.

- Levels of T-lymphocytes and subsets in T2DM patients and healthy individuals. Lymphocytes were isolated from the peripheral blood of T2DM patients and healthy individuals. The cells were then stained with anti-CD3 (APC Cy7), CD4 (APC), and CD8 (PE) and analyzed using flow cytometry. A) Dot plots showing the percentage of CD3+ T-cells in the samples obtained from healthy individuals and T2DM patients. B) The percentage of CD3+ cells in both groups is presented. C) Dot plots showing the percentage of CD4 and CD8 T-cells in the samples obtained from healthy individuals and T2DM patients. D) The percentage of CD4+ cells; and E) CD8+ cells in both groups is presented. Data were analyzed using an unpaired t-test. Values are presented as mean±SD. * p≤0.05, T2DM: type 2 diabetes mellitus
