
Figure 4.
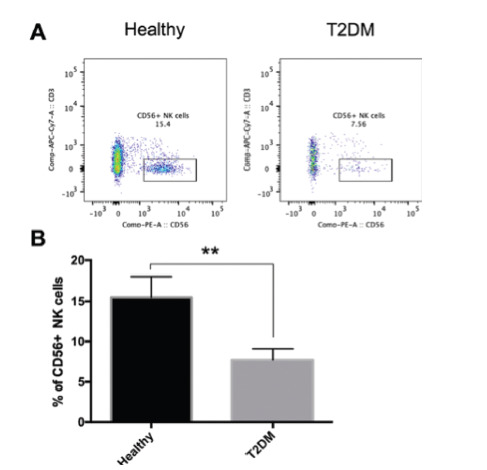
- Levels of NK cells in T2DM patients and healthy individuals. Lymphocytes were isolated from the peripheral blood of the T2DM patients and healthy individuals. The cells were then stained with anti-CD3 (APC Cy7), and CD56 (PE) and analyzed using flow cytometry. A) Dot plots showing the percentage of CD3-/CD56+ NK cells in the samples obtained from healthy individuals and T2DM patients. B) The percentage of NK cells in both groups is presented. Data were analyzed using an unpaired t-test. Values are presented as mean±SD. ** p≤0.01, T2DM: type 2 diabetes mellitus