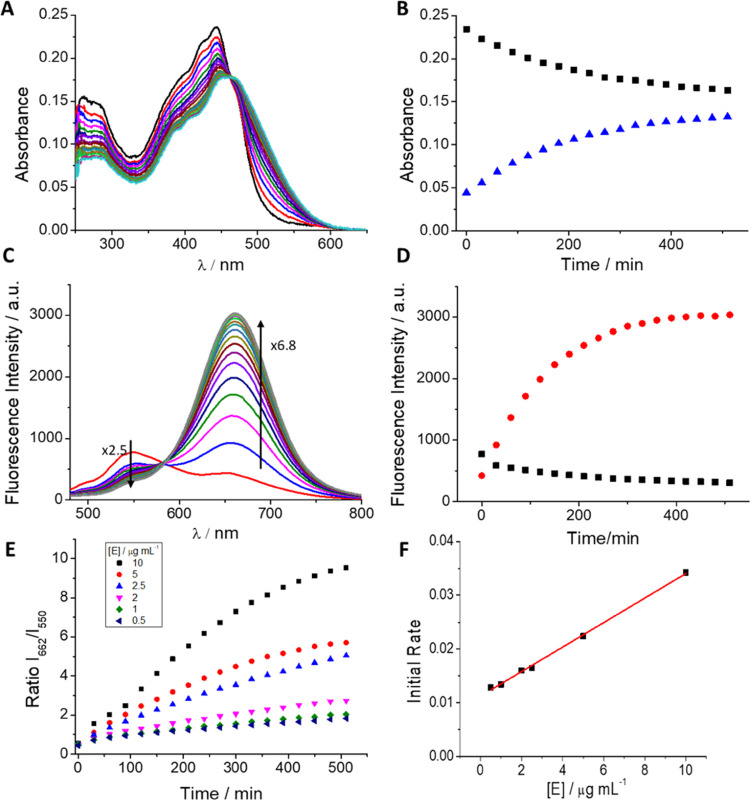
Figure 1.
(A) Evolution of the absorption spectra of DCM-NH-Pro-Gly (10 μM) with DPP IV (10 μg mL–1) in PBS/DMSO (7/3, v/v) every 30 min for 8.5 h at 37 °C. (B) Maximum absorbance values at 440 nm (black line) and 500 nm (blue line) vs time. (C) Evolution of the emission spectra of DCM-NH-Pro-Gly (10 μM) with DPP IV (10 μg mL–1) observed every 30 min for 8.5 h by excitation at 463 nm at 37 °C. (D) Maximum fluorescence intensity at 662 nm (red line) and the intensity decrease at 550 nm (black line) vs time. (E) Ratiometric measurements of fluorescence signals of I662/I550 of DCM-NH-Pro-Gly (10 μM) with different enzyme concentrations vs time. (F) Initial rates from ratiometric measurements vs enzyme concentrations.

