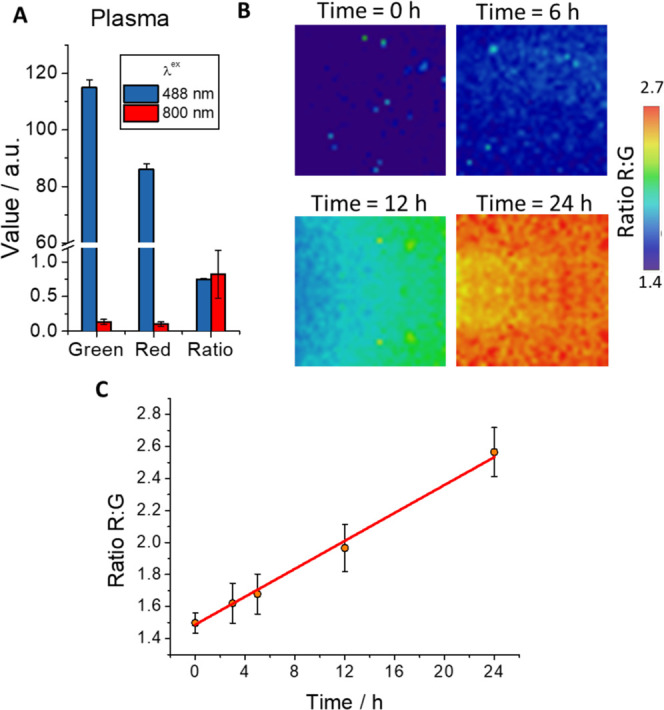
Figure 3.

(A) Intensity values of green (λem = 533–557 nm) and red (λem = 648–722 nm) channels and ratio maps using one-photon excitation at 488 and two-photon excitation at 800 nm of blood plasma sample. Whiskers represent the standard error (SE). (B) Representative ratio R/G maps of healthy human blood plasma with DCM-NH-Pro-Gly with DPP IV (10 μg mL–1) at different incubation times (λex = 800 nm). C) Ratio R/G average values of blood plasma with the probe DCM-NH-Pro-Gly images registered at different incubation times (λex = 800 nm). Line represents a visual aid. Whiskers represent the SE.
