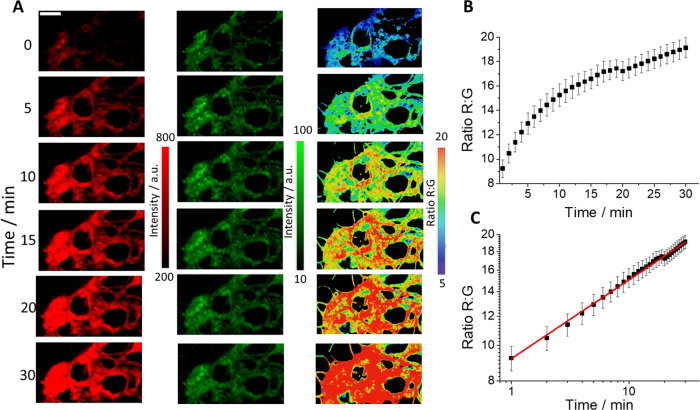
Figure 4.
(A) Images of a representative sample of the live Caco-2 cell line incubated with DCM-NH-Pro-Gly (2.5 μM) recorded in the red (left, λex = 450 nm, λem = 648–722 nm) and green (middle, λex = 450 nm, λem = 533–557 nm) channels at six different time points. Ratio R/G images (right) obtained at the same times. (B) Representation of the average values of the ratio R/G from five independent experiments. Error bars represent SE. (C) Double-logarithmic representation of the kinetics. Error bars represent SE. The red line is a linear fit with an intercept of 0.964 ± 0.004 and a slope of 0.215 ± 0.003 (R2 = 0.995).

