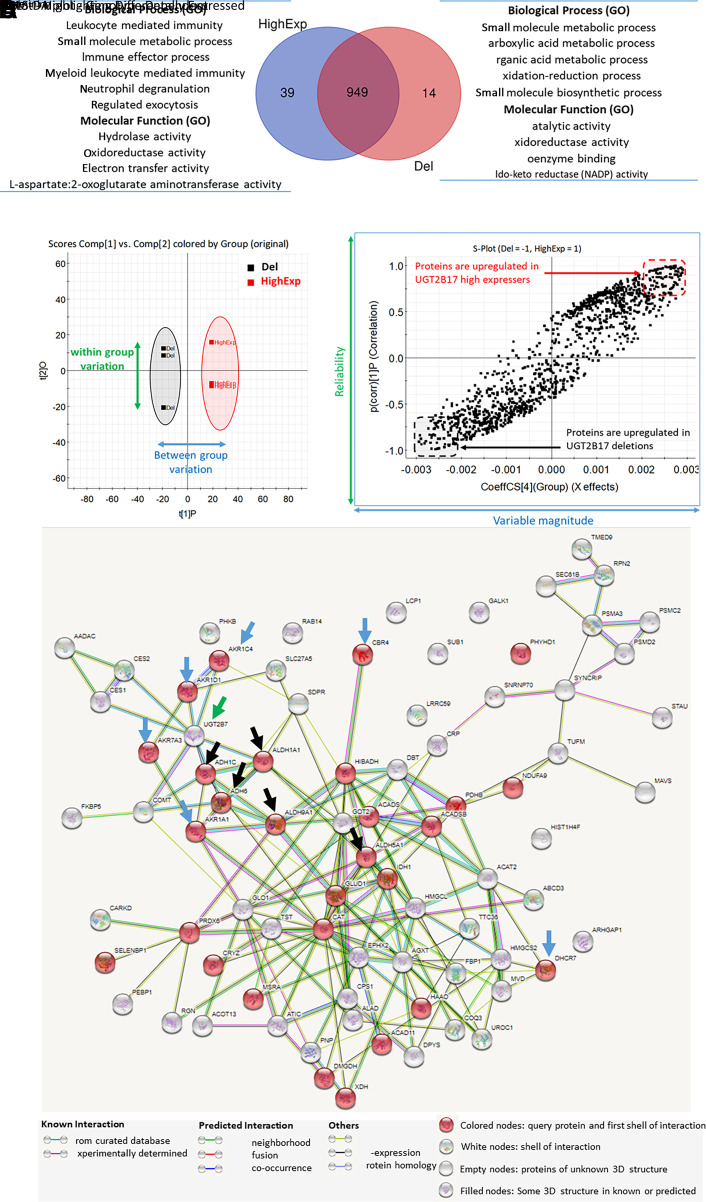
Fig. 2.
Untargeted proteomics data of the postmitochondrial (S9) fractions isolated from the liver tissue of the UGT2B17 deletion subjects (Del) versus UGT2B17 high expressers (HighExp). The Venn diagram represents the number of proteins identified in both the groups and the biological processes and molecular functions associated with significantly upregulated proteins (A). OPLS-DA analysis on the liver proteome shows clustering of individual samples between the deletion and the high-expresser groups (B). The S-plot from OPLS-DA model highlights the differentially expressed proteins in both the groups (C). Protein interactome analysis by STRING analysis of the upregulated proteins in UGT2B17 deletion (D). Significantly upregulated proteins in UGT2B17 gene deletion individuals are associated with aldoketoreductases [AKR1D1, AKR1C4, AKR1A1, AKR7A3, CBR4, and dehydrocholesterol reductase (DHCR)-7; indicated by blue arrows], aldehyde dehydrogenase pathways [aldehyde dehydrogenase (ALDH)-1A1, ALDH5A1, ALDH9A1, ADH1C, and ADH6; indicated by black arrows], and UGT2B7 (indicated by green arrow). The protein interactome of the downregulated proteins is presented in Supplemental Fig. 1.

