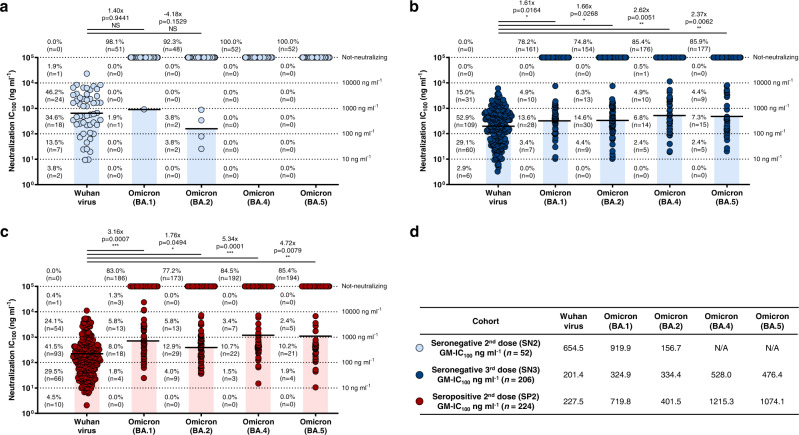
Fig. 1. Potency and breadth of neutralization of nAbs against SARS-CoV-2 Omicron variants.
Scatter dot charts show the neutralization potency, reported as IC100 (ng ml−1), of nAbs tested against the original Wuhan SARS-CoV-2 virus, and the Omicron BA.1, BA.2, BA.4 and BA.5 lineages for SN2 (a), SN3 (b), and SP2 (c), respectively. The number, percentage, GM-IC100 (black lines and colored bars), fold-change and statistical significance of nAbs are denoted on each graph. Reported fold-change and statistical significance are in comparison with the Wuhan virus. Technical duplicates were performed for each experiment. d The table shows the IC100 geometric mean (GM-IC100) of all nAbs pulled together from SN2, SN3 and SP2 against all SARS-CoV-2 viruses tested. A nonparametric Mann–Whitney t test was used to evaluate statistical significances between groups. Two-tailed p value significances are shown as *p < 0.05, **p < 0.01, and ***p < 0.001. Source data are provided as a Source Data file.

