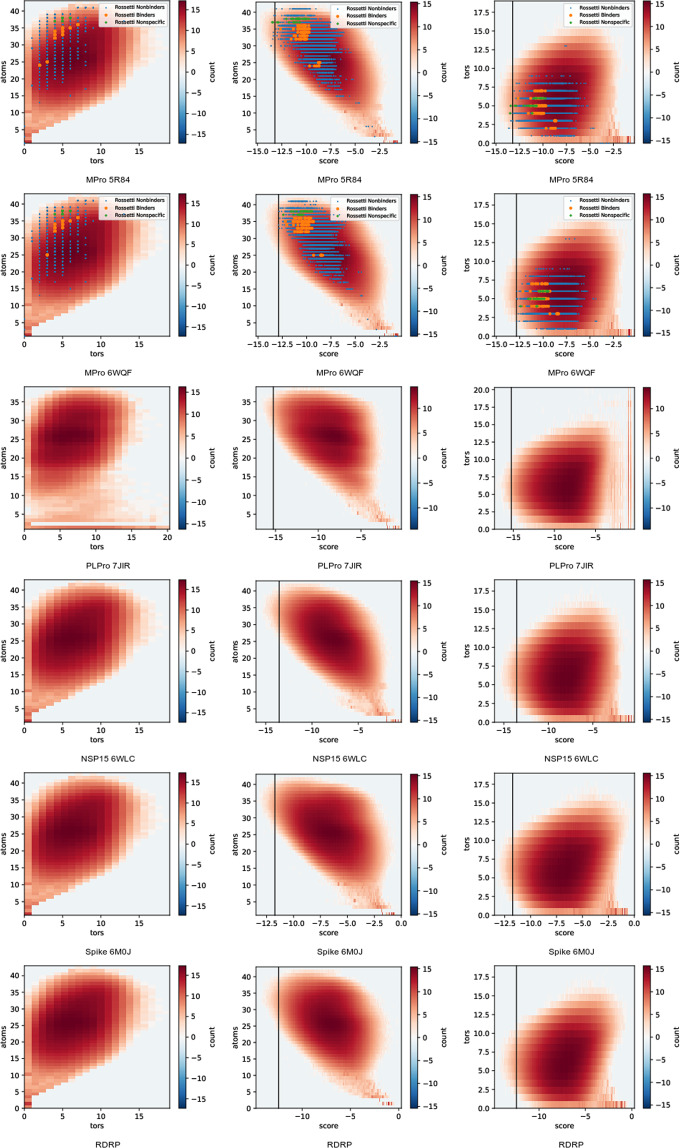
Fig. 2.
Molecule atom and torsion count 2D histograms, plotted on a natural logarithmic scale to emphasize the tails of the distribution. Columns contain, from left to right, (atoms,tors), (atoms,score) and (tors,score). Score refers to AutoDock-GPU’s score. Atoms refers to the count of heavy atoms plus polar hydrogens present in the pdbqt file used for docking. Tors refers to the count of torsion degrees of freedom marked in that pdbqt. Marked points show our data values for all compounds listed in ref. 50 (pooling all isomers and geometries).

