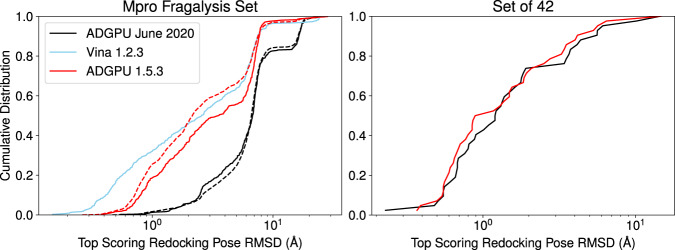
Fig. 4.
Redocking RMSD distribution against the Mpro Fragalysis dataset (left) and the AutoDock-GPU set of 42 (right), measuring the deviation between a predicted docking pose and an actual crystal structure. The fragalysis dataset (left) docks 426 ligands where bound crystal structures are available from the Diamond dataset, and compared the displacement for only the top-scoring pose from AutoDock Vina (blue)52, the current version of AutoDock-GPU (red, 1.5.3)15 and the version of AutoDock-GPU used to generate the dataset (black, June 2020). Beyond the top poses, the distribution for all 20 predicted poses for both versions of AutoDock-GPU are given as a dashed line. The set of 42 (right) similarly compares the cumulative RMSD distribution generated after redocking.

