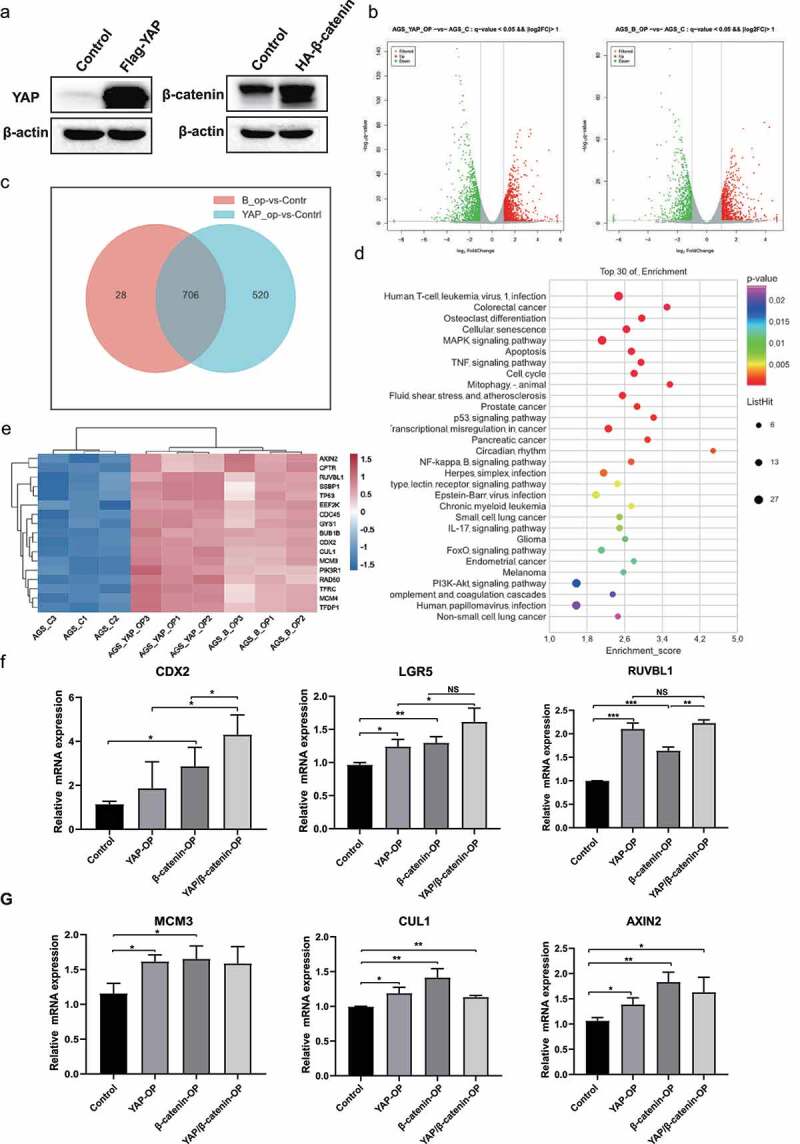
Figure 3.

Common transcriptomic profiling of YAP and β-catenin in gastric cancer cells. (a) After transfection with Flag-YAP or HA-β-catenin plasmid, Western blots showing the expression of YAP and β-catenin, respectively. (b) Transcriptomic analysis using RNA-seq of AGS cells overexpressing YAP or β-catenin was performed in YAP-overexpressing cells. Volcano plot showing the DEGs in YAP-overexpressing or β-catenin-overexpressing cells compared with the control group. (c) Venn diagram showing the overlapping downstream genes of YAP and β-catenin. (d) KEGG pathway enrichment analysis for overlapping target genes. (e) Heatmap showing the significantly upregulated genes that were enriched in the cell cycle, apoptosis, MAPK and TNF signaling pathways. (f) AGS cells were transfected with Flag-YAP and β-catenin plasmids either alone or in combination treatment. RT‒PCR analysis showing the mRNA levels of CDX2, LGR5 and RUVBL1. ***, P < 0.001; **, P < 0.01; *, P < 0.05. (G) RT‒PCR analysis showing the mRNA levels of MCM3, CUL1 and AXIN2. **, P < 0.01; *, P < 0.05.
