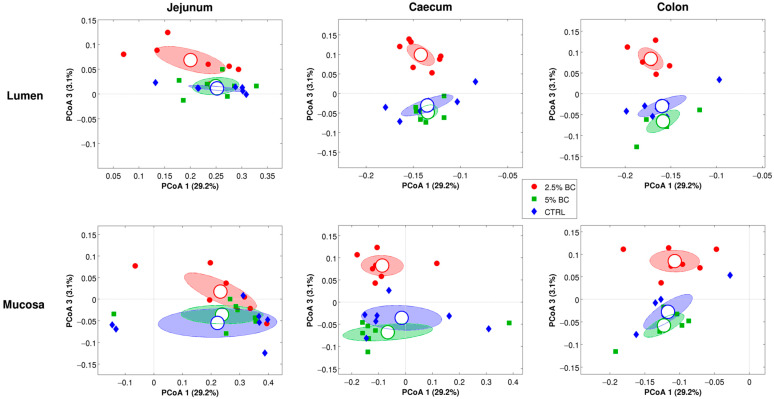
Figure 3.
Principal Coordinate Analysis (PCoA) based on the unweighted UniFrac distances for the three diet groups divided per intestinal tract and site. In each plot, each dot represents a sample, colored according to the diet group. Ellipses are the 95% SEM-based confidence intervals, whereas centroids are the average coordinates on all the samples. Coordinates 1 and 3 are represented.

