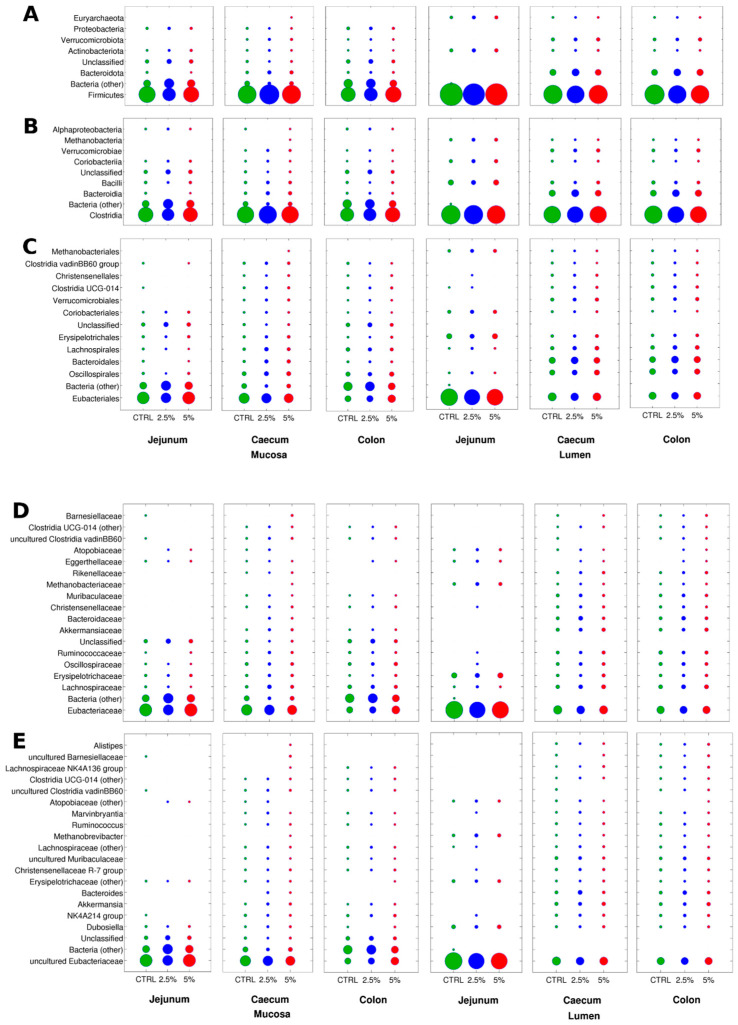
Figure 4.
Bubble plots of the relative abundance data (for each intestinal tract and site) over the three groups at all taxonomic levels: CTRL (green), 2.5% BC (blue), and 5% BC (red); phylum (A), class (B), order (C), family (D), and genus (E). Circle size is proportional to the average relative abundance. For each level, only taxa with avg. rel. ab > 1% in at least one of the groups are represented. “Missing” circles are taxa < 1% in that group.

