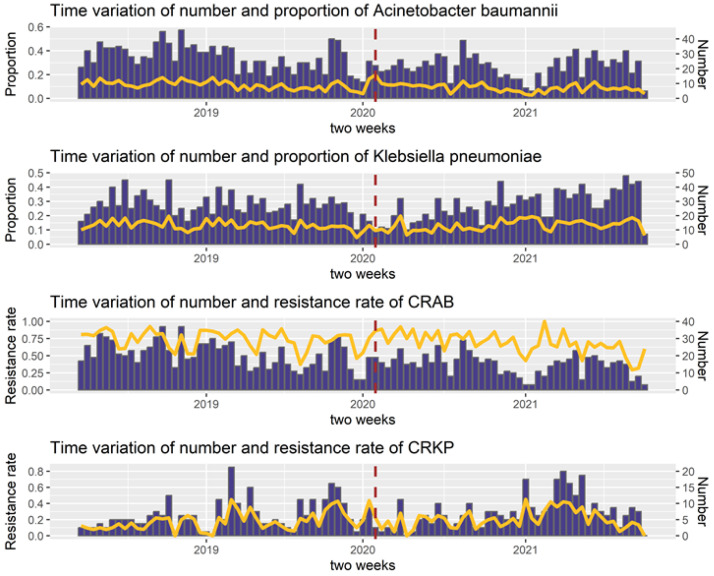
Figure 1.
Time trends of pathogens and drug-resistant bacteria. Data were collected on a biweekly basis. The dark red dashed line indicates the COVID-19 outbreak. The yellow line represents the proportion of the pathogen or resistance rate of the drug-resistant bacteria. The blue bars show the number of pathogenic or drug-resistant bacteria.

