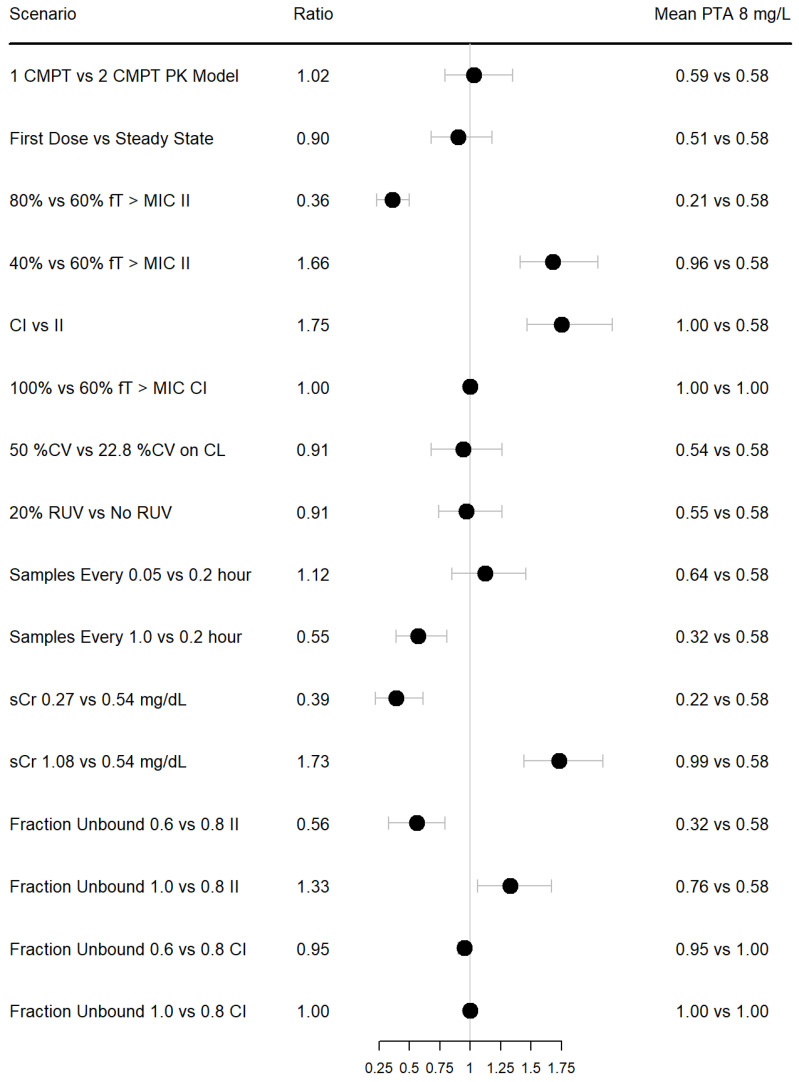
Figure 1.
Forest plot of ratio of mean PTA under different simulation conditions using a population PK model developed by Álvarez et al. Dosing used was 2000 mg IV q8 h over 30 min unless otherwise stated. Continuous infusions matched the total daily dose of 6000 mg. Samples were simulated every 0.2 h unless otherwise stated. Error bars represent 90% CIs. II = intermittent infusion; CI = continuous infusion; RUV = residual unexplained variability; sCr = serum creatinine.

