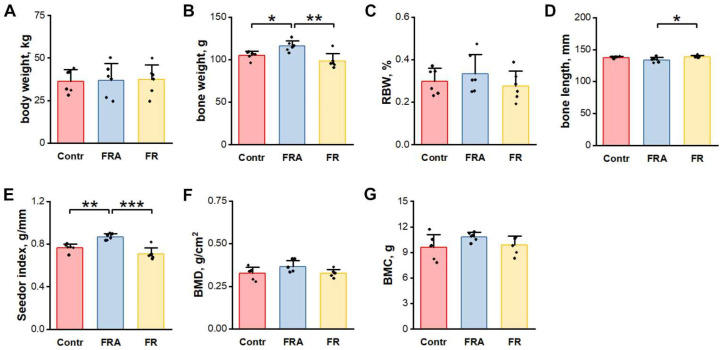
Figure 1.
(A) Pig weights and basic femur properties of animals in experimental groups: (B) bone weight, (C) relative bone weight (RBW), (D) bone length, (E) the Seedor index, (F) bone mineral density (BMD), (G) bone mineral content (BMC). Bar plots show mean values and standard errors. A range of p-values has been assigned above plots where two groups show significant differences: * p < 0.05, ** p < 0.01, *** p < 0.001.

