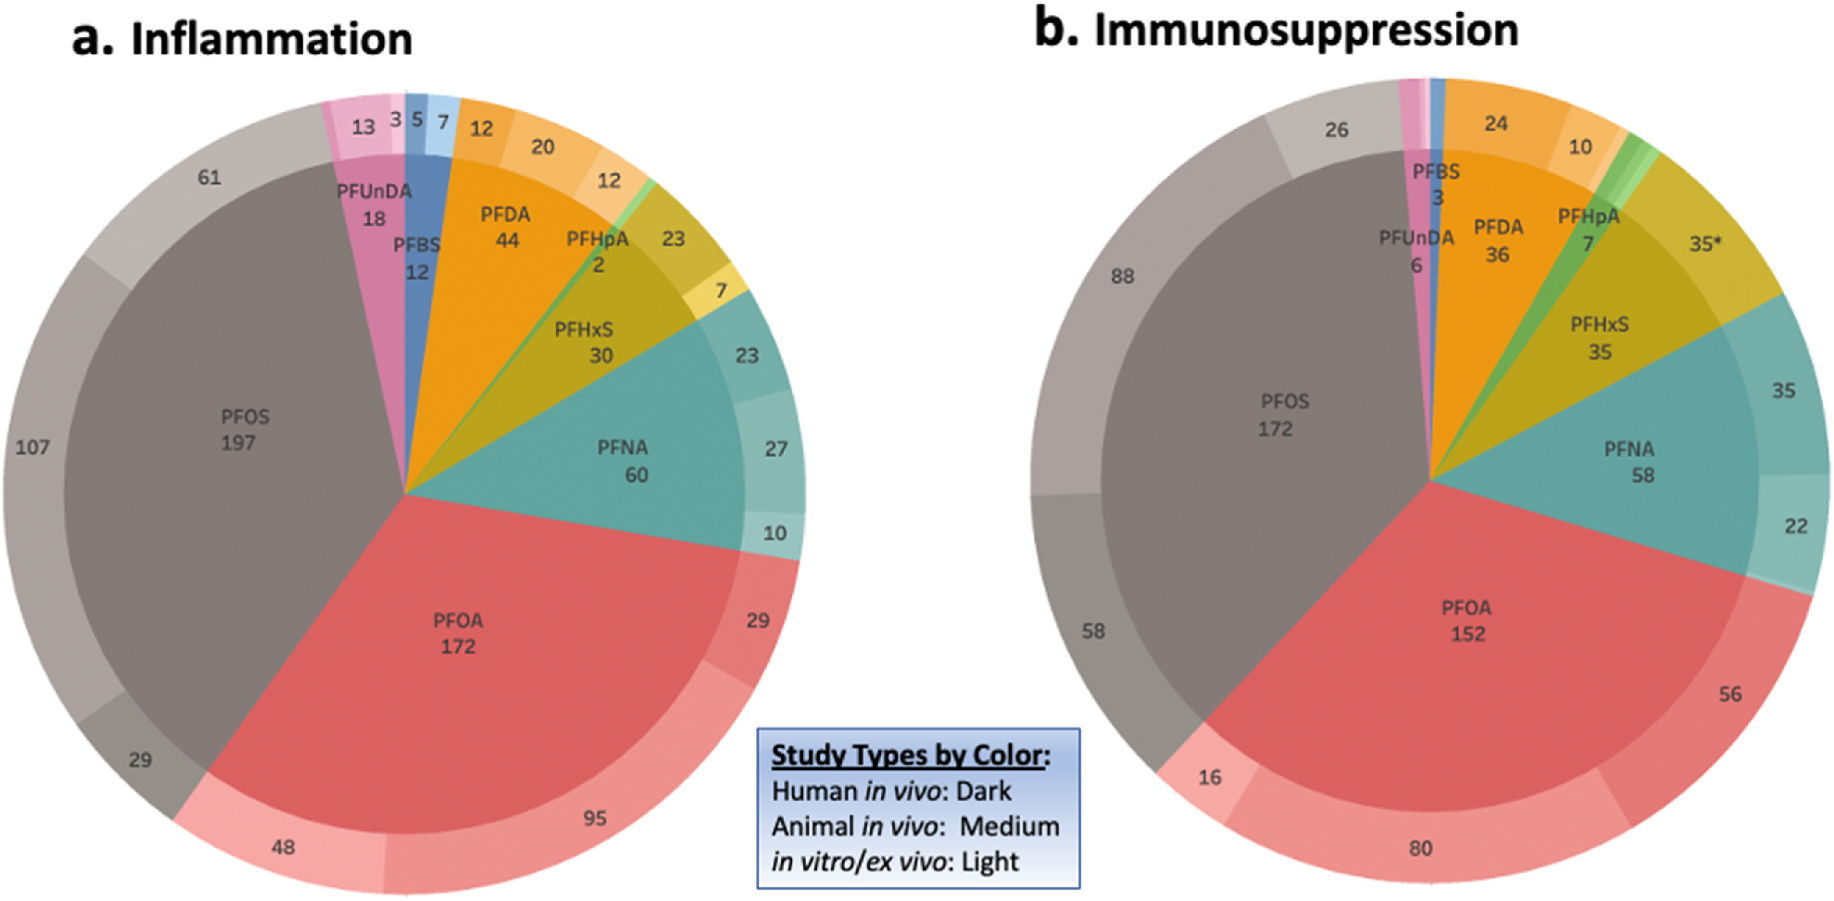
Fig. 3.

Map of study numbers by study types per PFAS exposure type
Pie charts depict the total number of studies on inflammation (3a) and immunosuppression (3b), which are broken down into their respective PFAS exposure and further divided into the three study types. Biomarkers that were examined in two different study types (i.e. human in vivo or animal in vitro) within the same study were counted as two separate study types. (*Indicates that the study type for PFHxS (3b) is human in vivo).
