Figure 2.

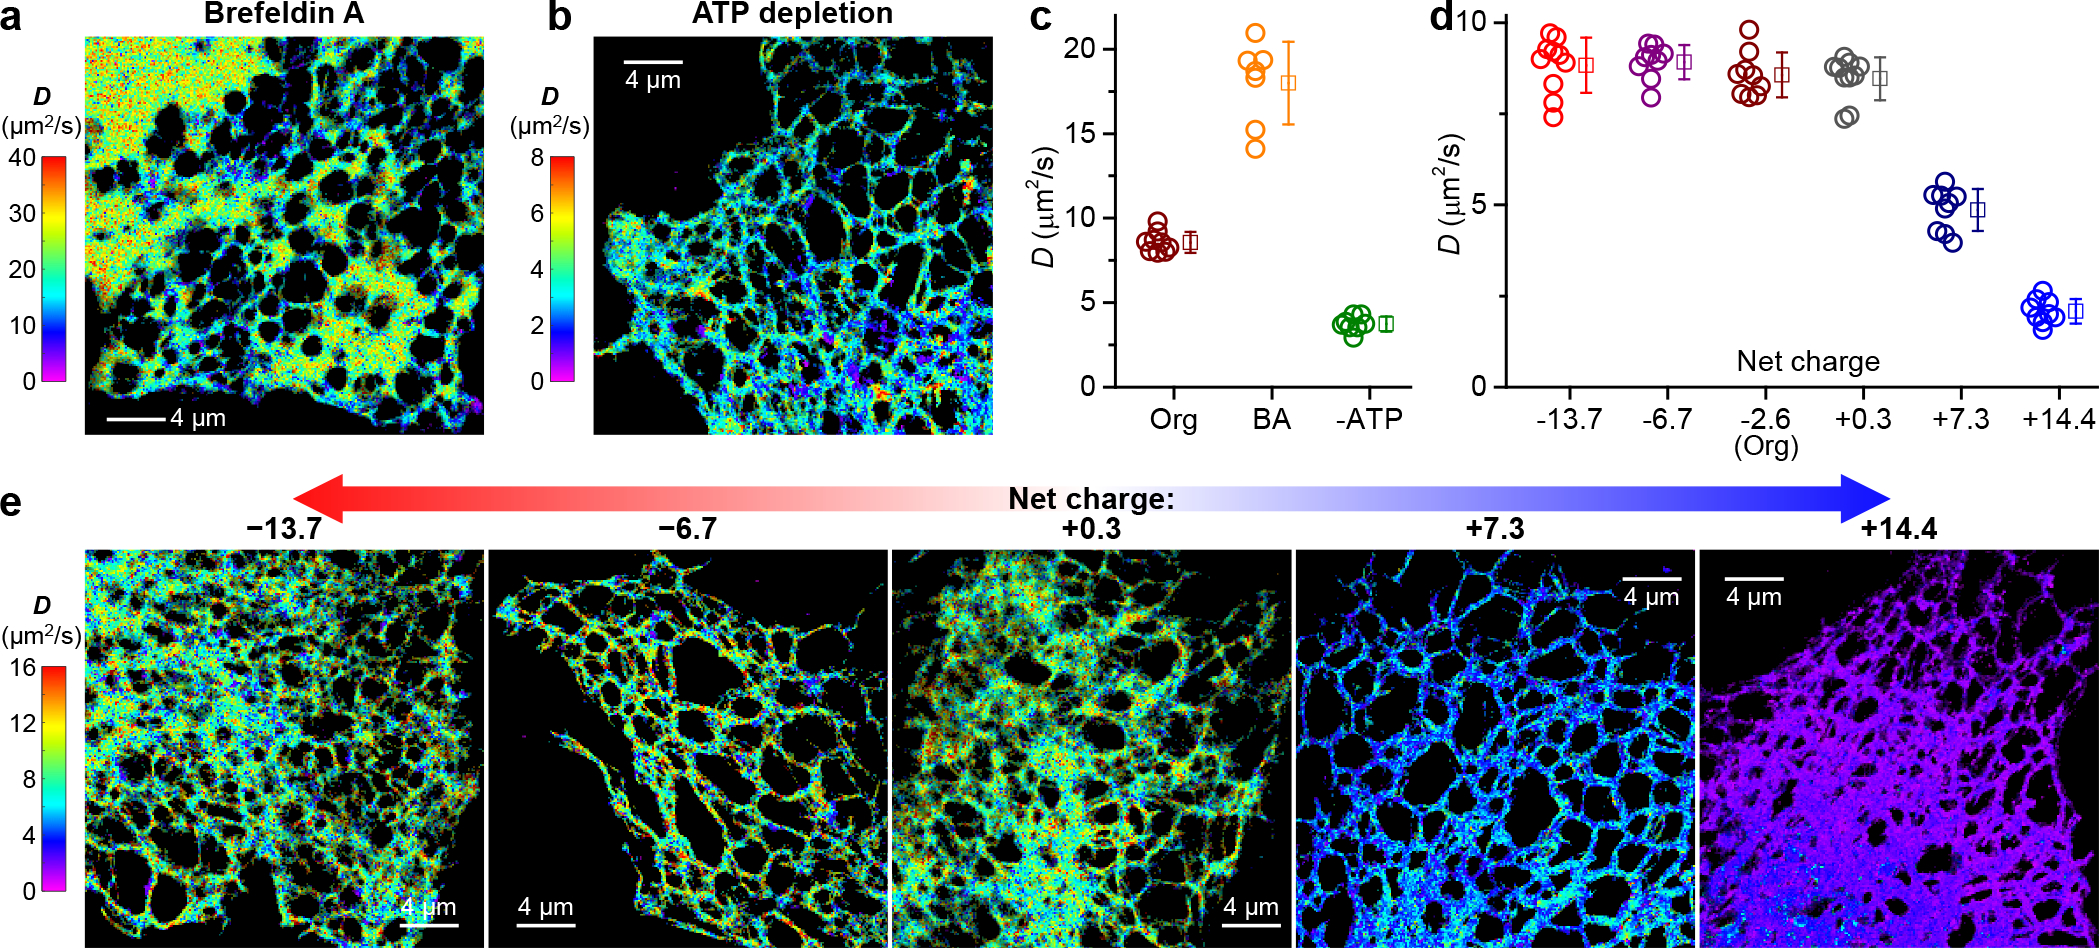
pSMdM quantification of intra-ER diffusion and charge effects. (a,b) Representative pSMdM super-resolution D maps for ER-Dendra2 in the ER lumen of live COS-7 cells, after Brefeldin A treatment (a) or ATP depletion (b), respectively. (c) pSMdM-determined D values of ER-Dendra2 in untreated (Org), Brefeldin A-treated (BA), and ATP-depleted (-ATP) COS-7 cells. (d) pSMdM-determined D values for the different charge-varied versions of ER-Dendra2 diffusing in the ER lumen of live COS-7 cells. In (c,d), each circle presents the holistic D value extracted from an individual cell. Squares + bars: averages and standard deviations. (e) Representative pSMdM super-resolution D maps of the differently charged ER-Dendra2 versions. Note that different color scales are used in (a,b,e) to present the different D ranges.
